GA4: Video Engagement Data
How to find Video Engagement Data in GA4 and how to report this data.
1. Enable video engagement tracking
Admin panel > Property column > Data Streams > Data stream (click on it)
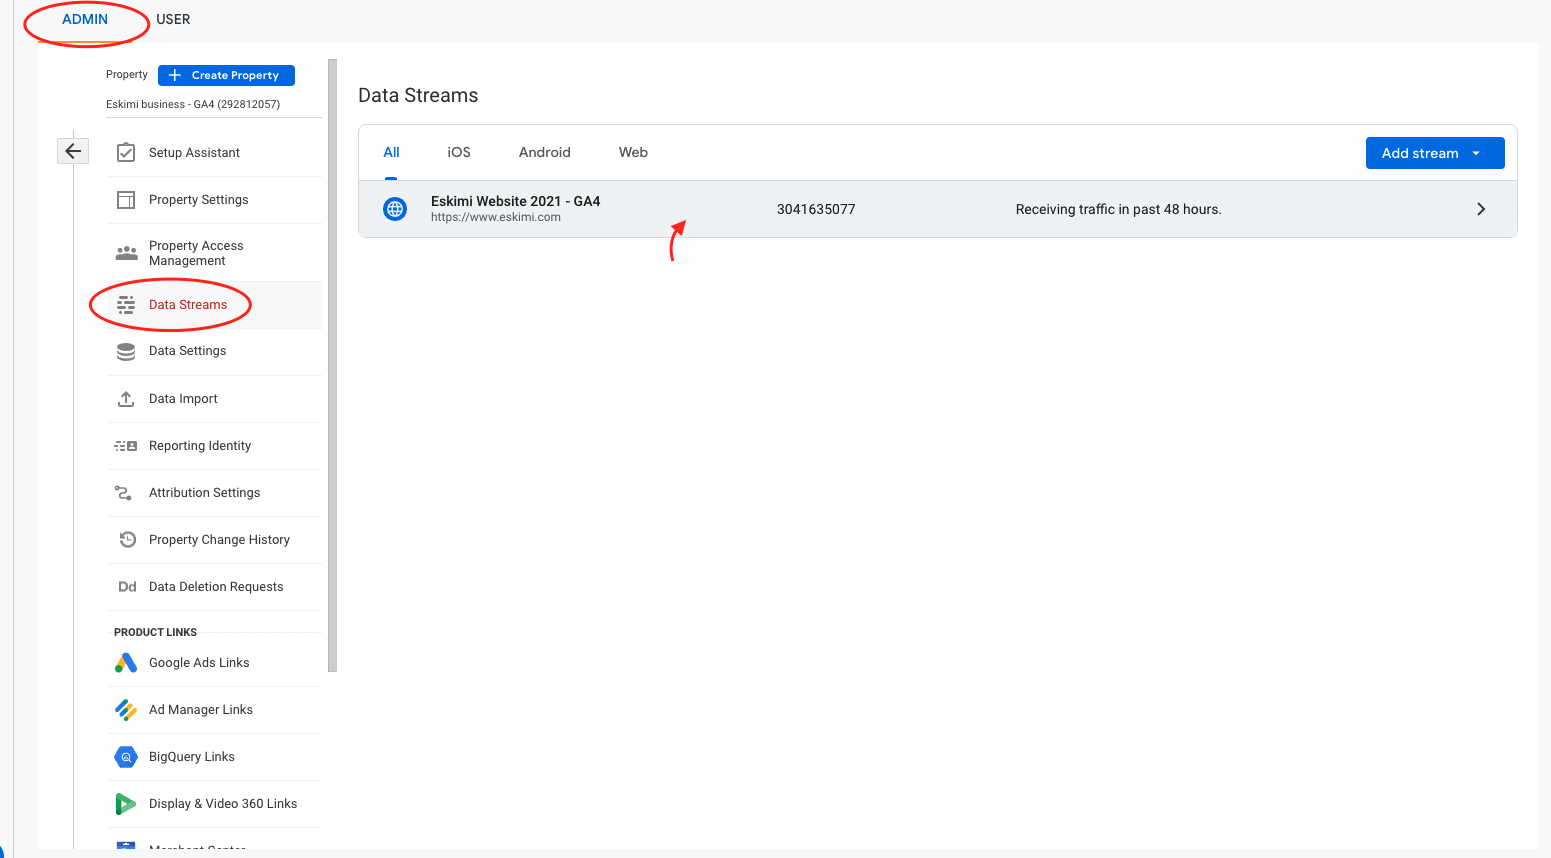
Make sure that Enhanced measurement is active - if not, activate it.
Then click the settings button.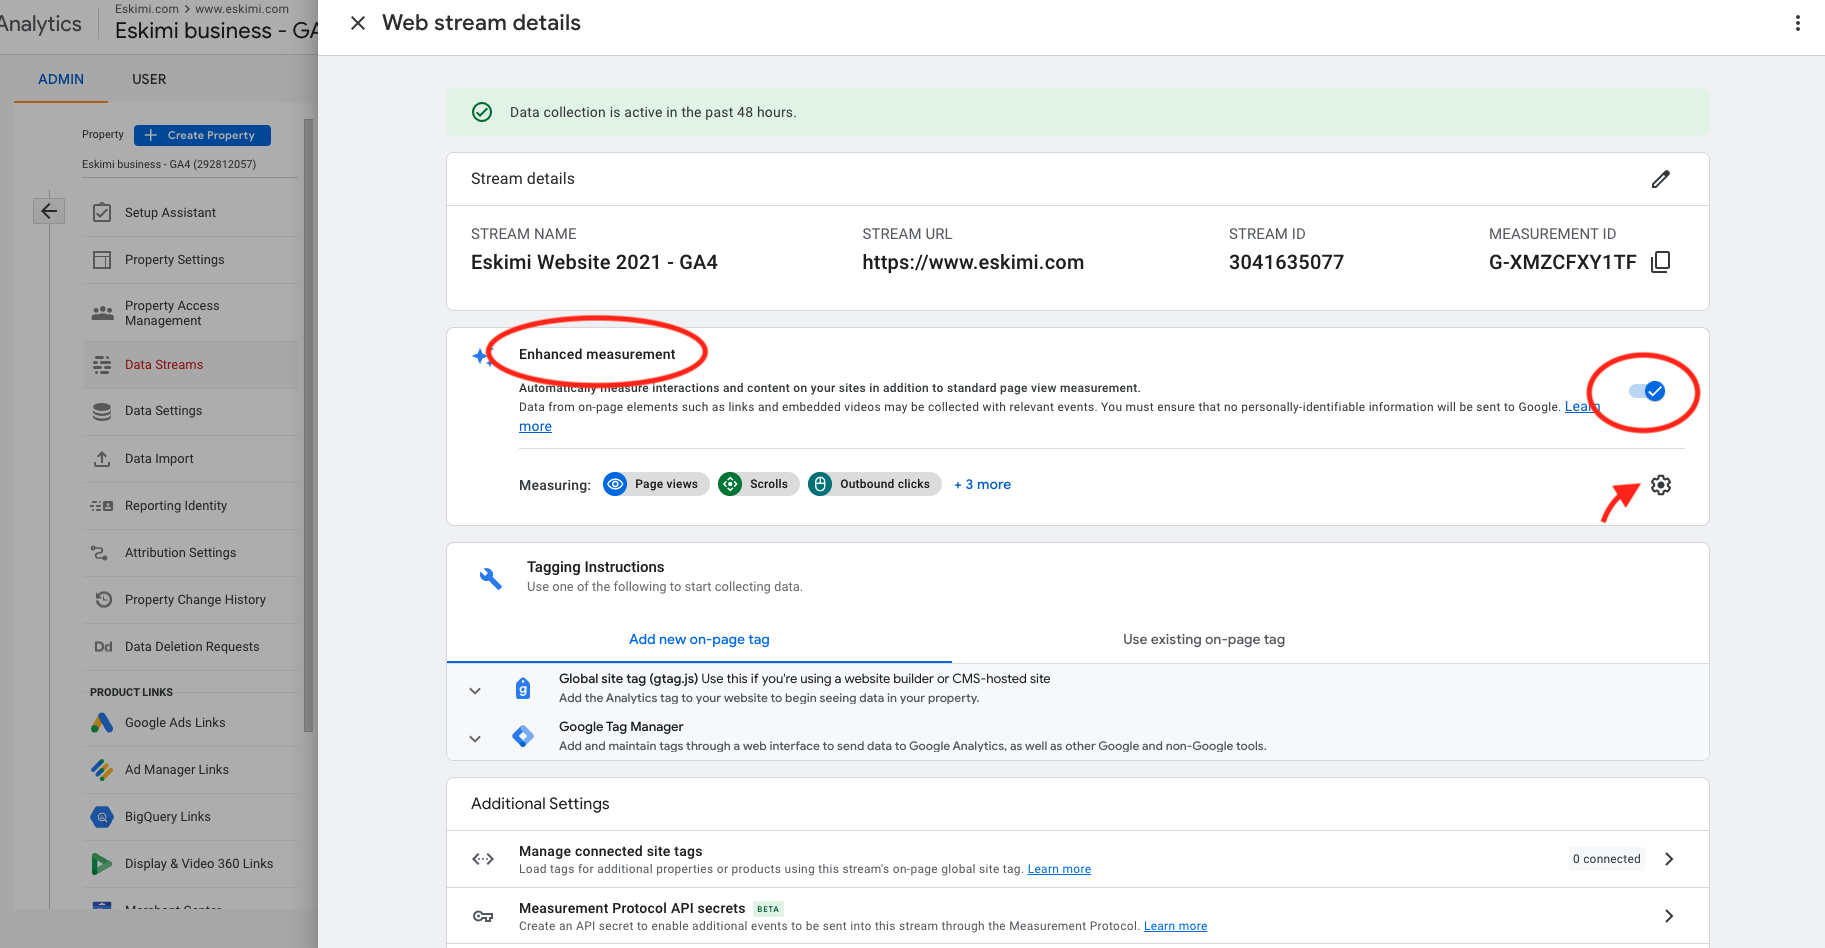
Make sure that Video Engagement is active - if not, activate it.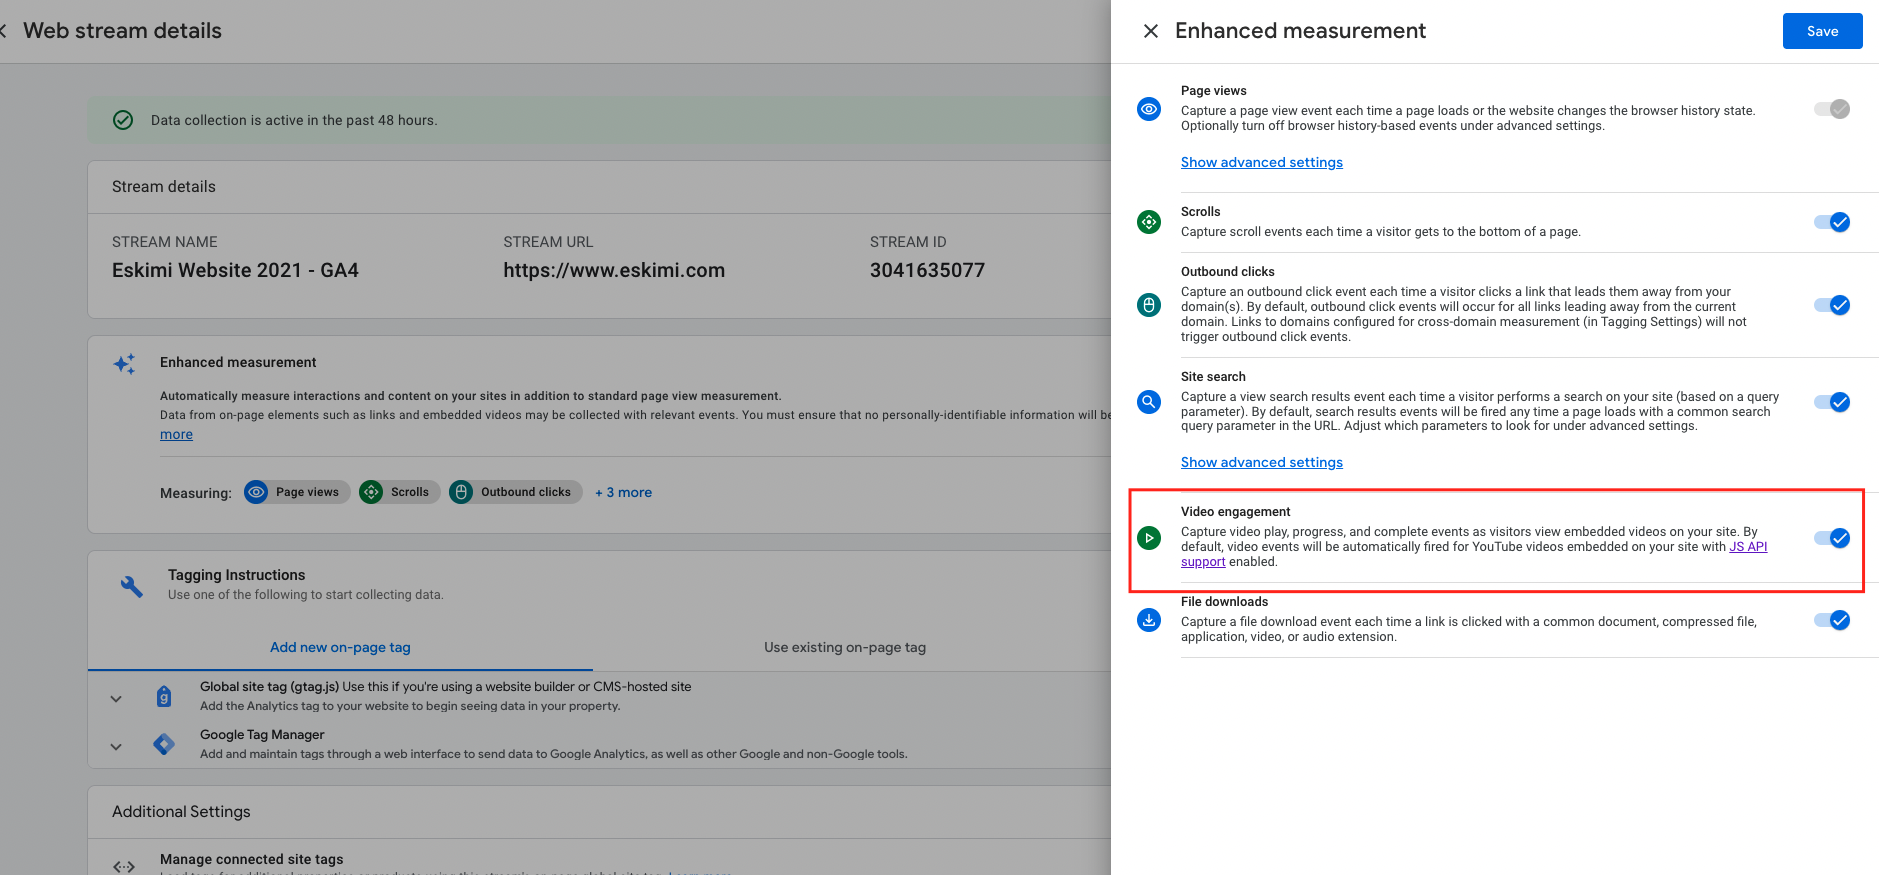
If you have just enabled that, you will need to wait for ~24 hours to start seeing that data in standard and custom reports.
2. Standard Reports
They are called video_start, video_progress, video_complete. These are available once Enhanced Measurement is active.
Go to Reports > Engagement > Events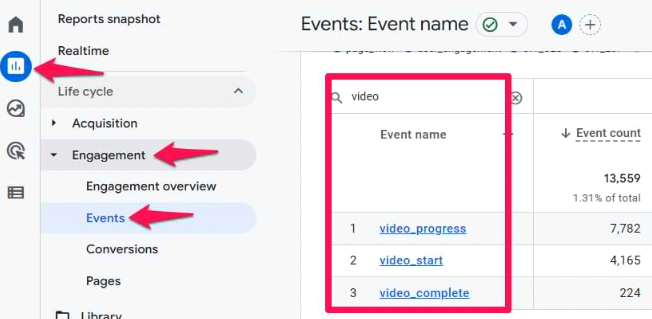
3. Custom Reports (Explorations)
If you want to see what links were clicked and how many times that occurred, you will need to create a custom report in the explore section.
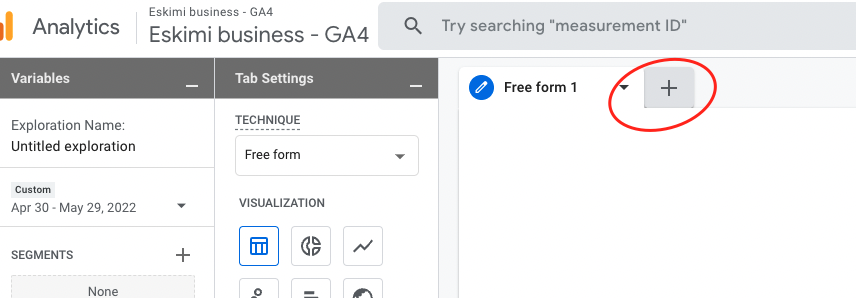
GA4 > Explore > Blank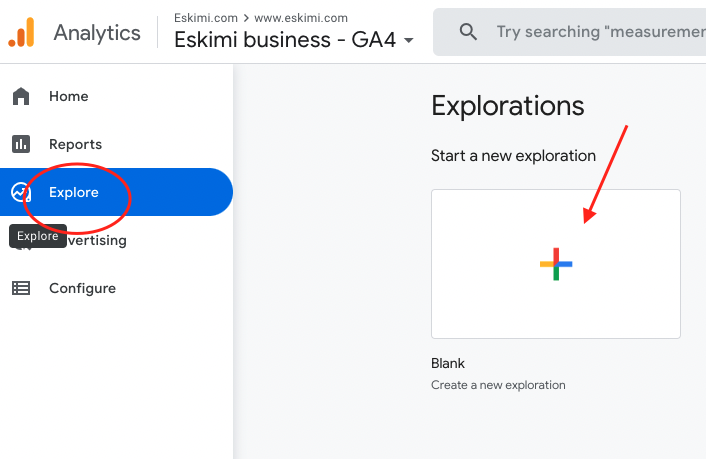
You need to import Dimensions, so click the Pus icon: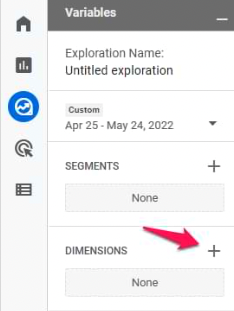
Then select Event name, Video title, Video URL dimensions, and click Import.
In the metrics section, click the Plus icon and add the metrics that you want to use, for example, Event count and Total Users.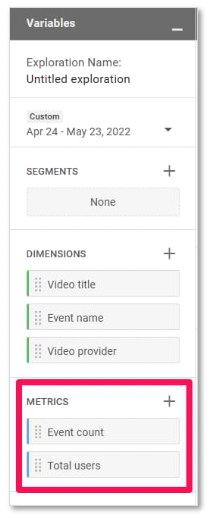
If you want to see a list of video titles, then double-click the Video Title dimension and also all metrics that you have imported to the exploration. Or just drag-and-drop them.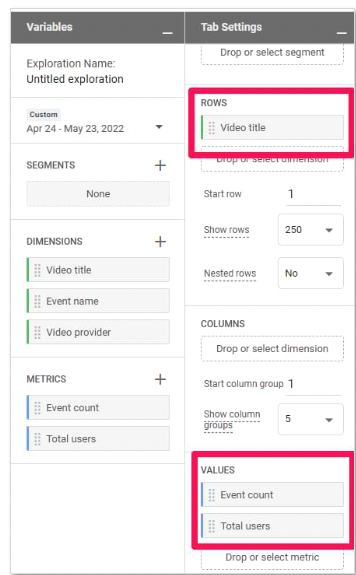
If you want to narrow down the data, then in Filters section, apply filters.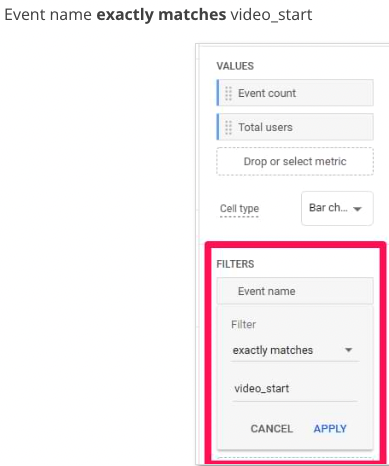
Video watched percentage
One of the events that Google Analytics 4 tracks automatically is called video_progress.
(When a video is watched by more than 10%, 25%, 50%, and 75%)
These metrics are tracked but they are not displayed in the GA4 interface.
To fix this issue, we need to create an event scoped custom dimension.
Configure > Custom Definitions > Create Custom Dimensions and enter the following settings:
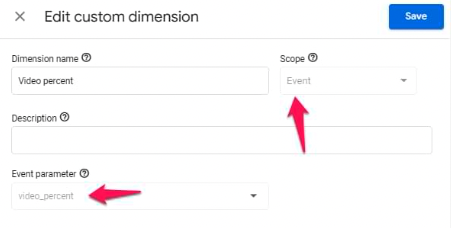
The scope should be Event and the Event parameter should be video_percent.
Please allow 24 hours after you create the dimension in order to start seeing data in explorations.
This change applies only to new data.
The Video Percent dimension will not display historic data.
In the same exploration, click the Plus to add a new tab.
Then import a Video percent dimension (in a similar way as you did in the previous chapter with Video title).
After that:
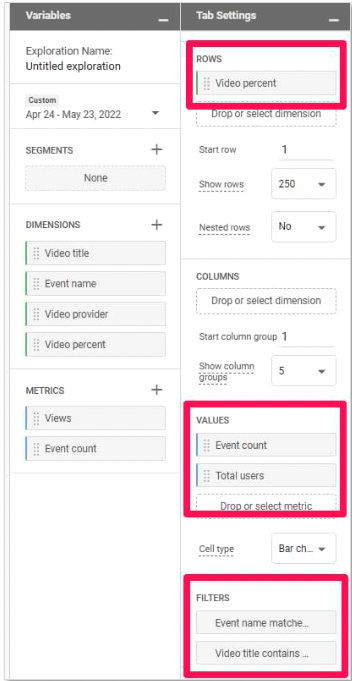
- Add the Video Percent dimension into the Rows section of the exploration
- Make sure that no other dimension is there
- In the Metrics section, add Event Count, Total Users
- Create two filters with conditions:
- Event name matches regex video_progress|video_start
- Video title contains [enter the title of the video you wish to analyze]
Please note that you might also see other percentages like 5, 9, etc.
This happens because a Youtube player remembers where a visitor stopped watching a video.
More: How to Track Youtube Videos in a website with GTM and GA4 (Enhanced Measurement alternative).