Reporting
- Eskimi optimisation possibilities
- Dashboard overview page
- Bounce Rate Optimization Via Eskimi DSP
- Expectation vs. Reality: Clicks = Sessions?
- Report overview and how to download it?
- Footfall
- Visits
- Engaged sessions
- Reporting filters - what and how to check?
- Looker Studio integration (external)
- Filtered Impressions
- Reach Calculation on Eskimi DSP
Eskimi optimisation possibilities
The purpose of optimisation is to improve how well your campaign achieves its objectives. It involves modifying your advertising strategies in accordance with the data you collect. Eskimi DSP supports multiple optimisation techniques, which can be used to make adjustments in campaigns. Utilizing these possibilities, you will be able to reach the performance that aligns with your advertising goals.
The optimisation process itself can appear to be an easy task; however, it is essential not to get lost in multiple techniques and focus on the main campaign's objectives. Therefore, it is essential to:
- Set the right goal for your campaign
- Determine primary and secondary objectives to measure progress
- Use tools like Google Analytics (GA) to track and measure post-click performance.
Eskimi has two main types of optimisation:
1) Auto-Optimisation (Goals and Objectives included when creating the campaign)
2) Manual Optimisation (Targeting Optimisation Tool)
Eskimi DSP auto-optimisation (goals and objectives)
When you set specific campaign goals and objectives, such as awareness or traffic, it allows the auto-optimization algorithms to focus on those specific metrics. Eskimi DSP platform will then automatically optimize ad placements, creatives, and publishers to achieve predefined objectives.
Auto-optimisation works based on the set objective values in the primary and secondary campaign objective sections. That means that the system will bid on specific placements in order to determine if it meets objective values. If the placement will not meet the value, the system won't bid on it anymore.
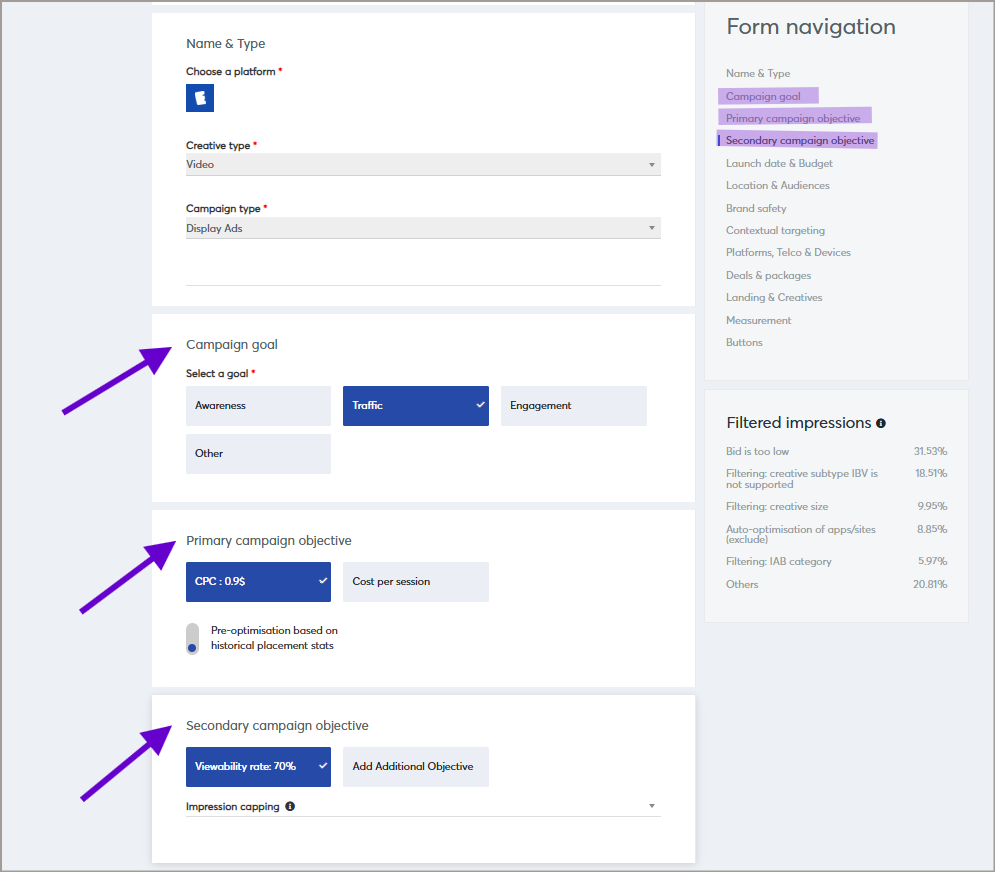
Additionally, there is a possibility to set Pre-optimisation based on historical placement stats to enhance campaign performance. Historical placement stats refer to the data and performance metrics collected from previous campaigns' advertising placements.
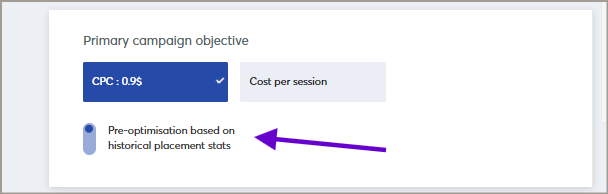
Pre-optimization using historical placement stats streamlines campaign setup by leveraging proven successful strategies, reducing trial-and-error, and optimizing resource allocation. However, considering factors like advertising changes, consumer behavior, and platform updates is crucial for ongoing optimization.
Campaign objectives differ based on the campaign's type. Display campaign support auto-optimisation based on: CPC (cost per click), CTR (click through rate), CPA (cost per action), VR (viewability rate), CVR (click to visit rate), ER (engagement rate), CPE (cost per engagement), CPVst (cost per visit), SR (session rate), CPS (cost per session). Video campaign support: CPC, CTR, CPA, MVTR (minimum view-through rate), CPCVV (cost per completed video view), VVR (video viewability rate), SR, CPS.
Limitations:
- CPA auto-optimisation is supported only once Eskimi conversion pixel is implemented.
- CVR, SR, CPVst, and CPS auto-optimisation are supported only once Eskimi audience pixel is implemented.
- Eskimi DSP supports main and custom conversions' tracking; however, the optimisation can be done only by the main conversion performance.
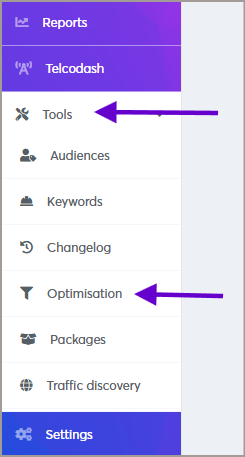
Manual optimisation (Targeting optimisation)
The manual optimisation can be found in Eskimi DSP Targeting optimisation section. It allows us to analyze the campaign's performance (historical data) by listing segments and by all performance metrics, and optimize by pausing the individual elements, such as specific creative, exchange, and site.
Manual optimisation can be done by the following segments:
- exchange
- creative
- operating system
- browser
- operator
- app/site name
- package
- placement
Audience and conversion pixels
In order to track retargeting (site first party) audience, engaged sessions, and conversions, it is necessary to implement Eskimi tracking pixels on the landing page.
Implemented pixels allow you not only to see the metrics but also to optimize them, which is significantly important. With implemented pixels, you can see (just a few examples):
- From which websites or apps the conversions were made, and based on that, optimize the inventory
- What is the conversion rate of a particular creative, which allows for optimization of creatives
- Which browsers generate the most sessions, which gives the opportunity to optimize for browsers.
Audience and conversion pixels give you multiple opportunities to optimize for better performance; therefore, it is strongly recommended to implement them for multiple campaigns' objectives.
UTM
The UTM helps to indicate performance based on a specific segment on the Google Analytics side. For example, UTM content part {site_id} is crucial if we want to see the performance on GA side by site and site ID. This allows you to create the whitelist/blacklist based on the performance with specific site/app IDs and use it in Eskimi DSP campaign.
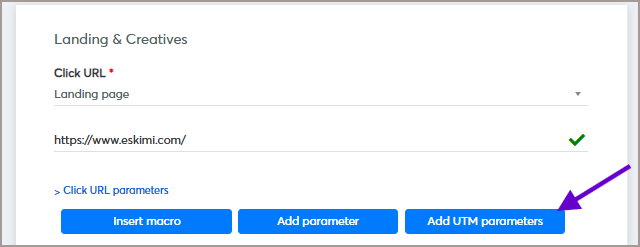
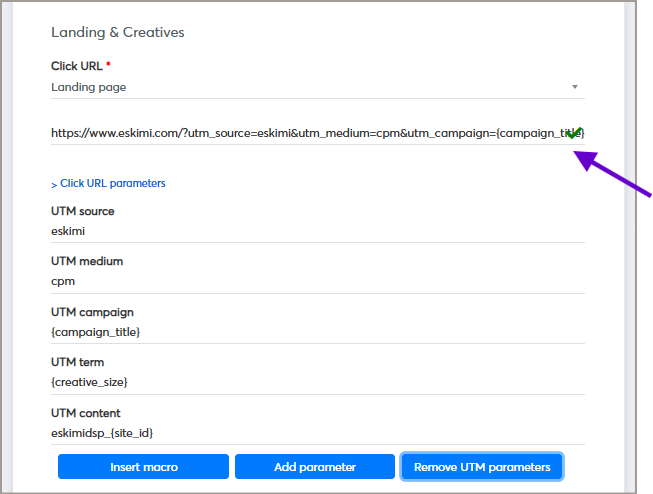
By default, ESKIMI UTMs include:
UTM source - eskimi
UTM medium - cpm
UTM campaign - {campaign_title}
UTM term - {creative_size}UTM content - eskimidsp_{site_id}
The UTMs' values and macros can also be updated based on the needs.
It is a pretty common case that the GA report shows a poor performance of a specific campaign in terms of session rate, bounce rate, etc., while the landing page of that particular campaign does not have any UTMs. That means that you are not able to filter the performance by site ID or any other segment on the GA side, therefore leaving you without any possibility to optimise the campaign on Eskimi DSP side.
Integral Ad Science (IAS), DoubleVerify (DV)
Integral Ad Science (IAS) and DoubleVerify (DV) trackers are most often used for tracking and evaluation of inventory and traffic quality, and viewability. By default, all these trackers evaluate performance by bundle/domain. However, it is possible to have more segments, such as campaign ID, creative ID, and more.
For example, the Eskimi DSP IAS pixel includes: campaign ID, site title, site ID, and creative size. These macros indicate that there will be a possibility to analyze the performance by the mentioned splits and to optimize them.
All of the mentioned trackers provide information on inventory and traffic quality, which can be used for manual optimisation on Eskimi DSP side. The manual optimisation can be done on IVT (invalid traffic), viewability, and other metrics, which can improve the overall performance.
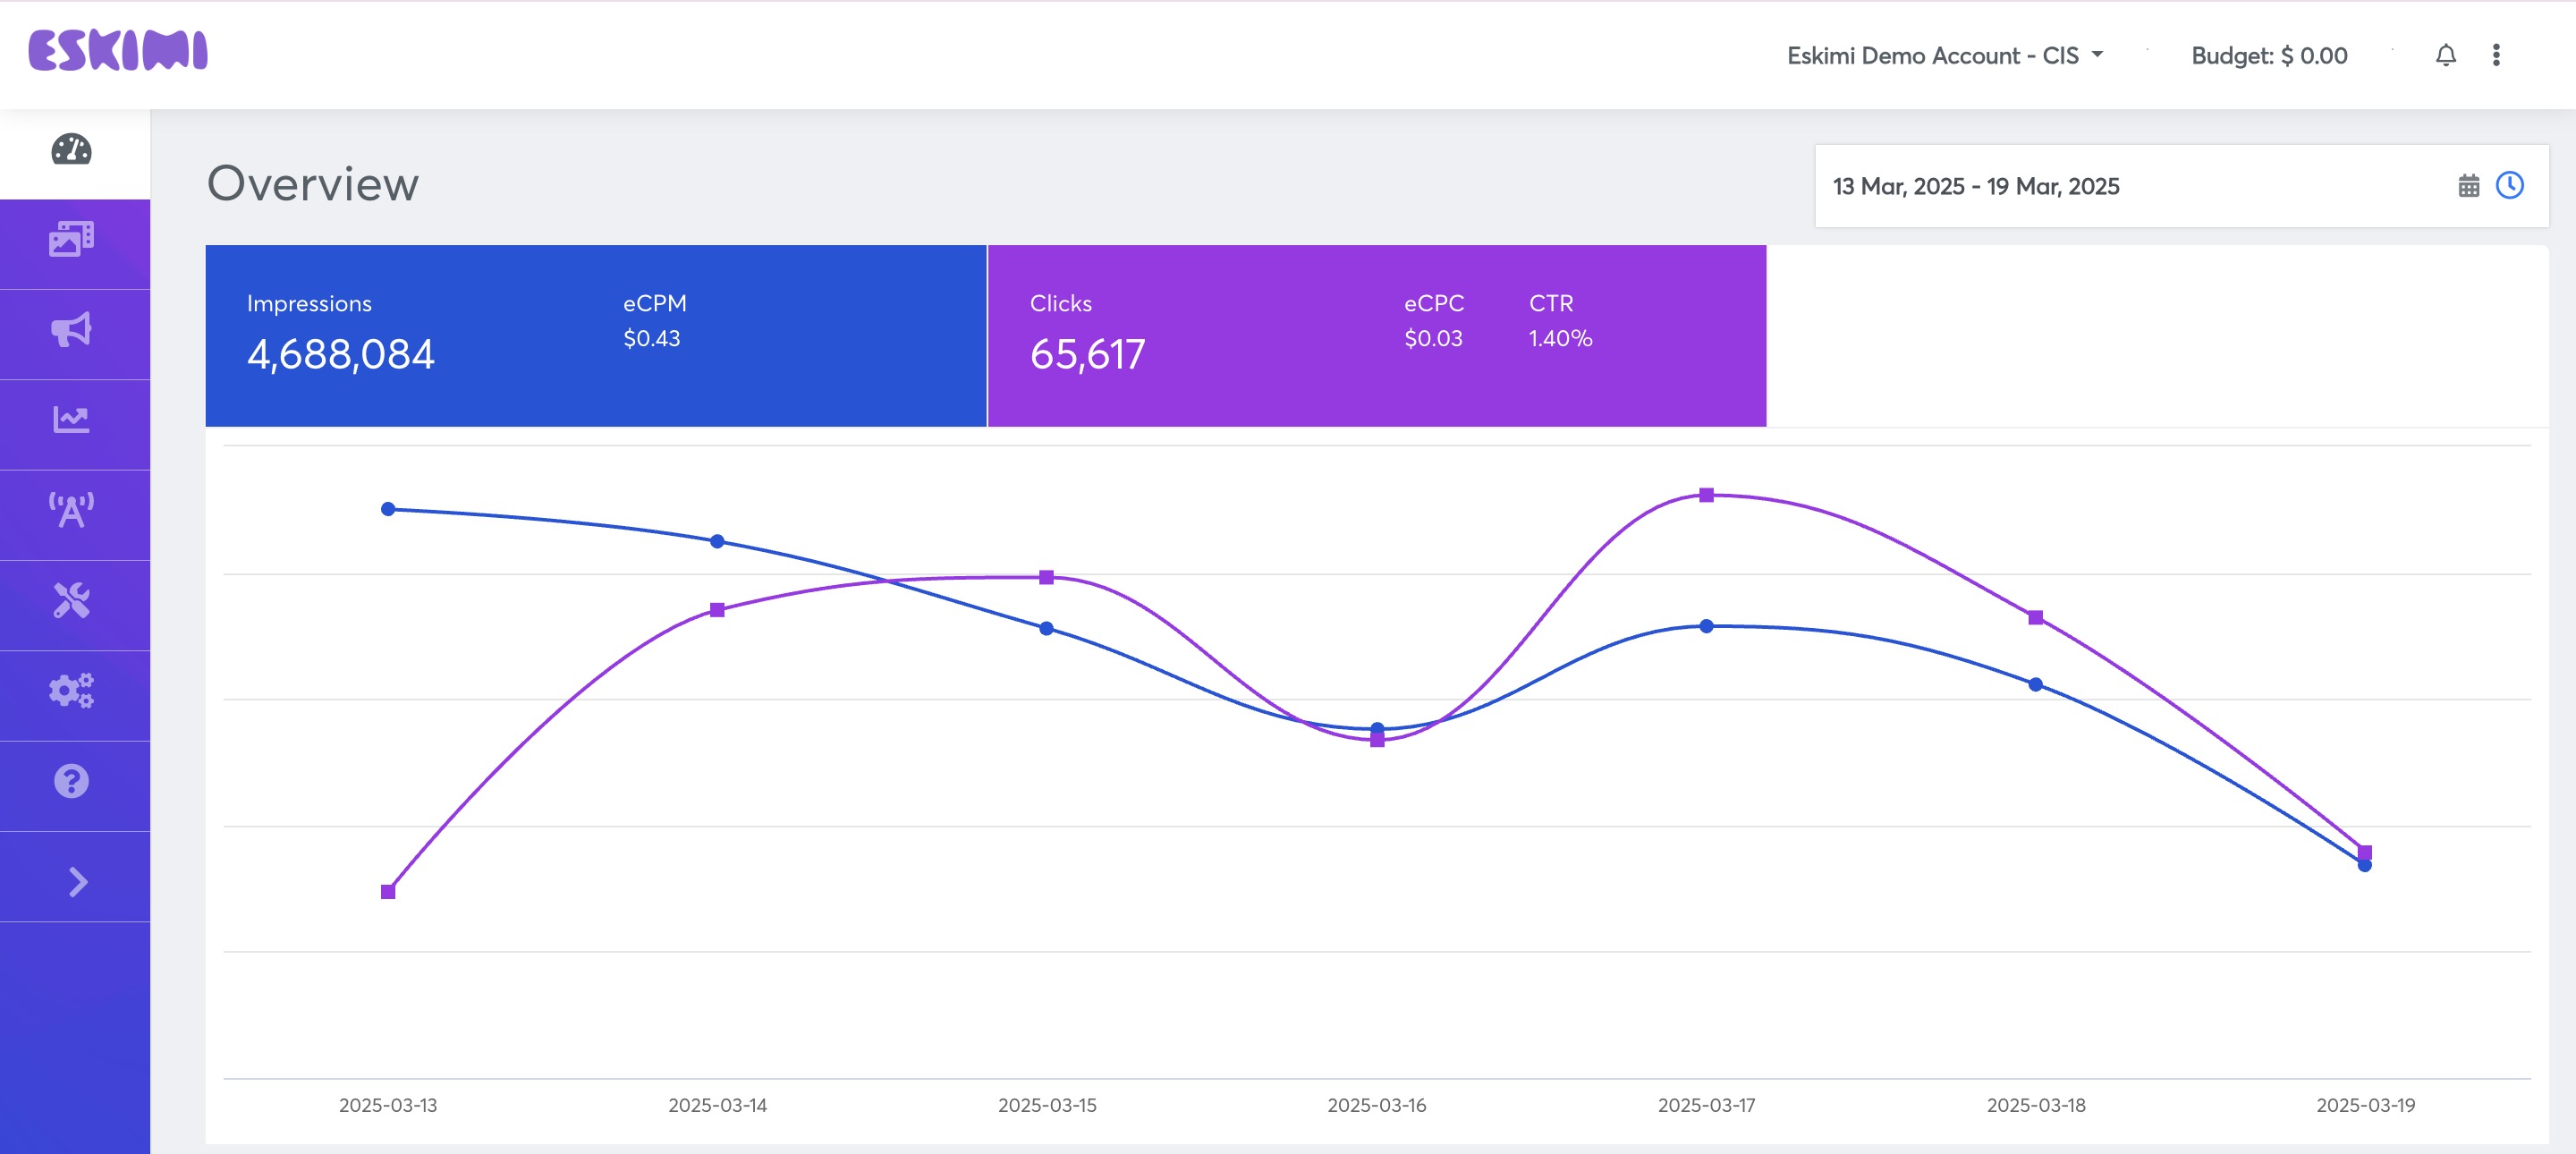
Dashboard overview page
The Eskimi DSP Dashboard is a centralized view where advertisers can monitor and analyze their campaign performance over a selected period. It provides an aggregated summary of key campaign metrics, helping users track ad spend, impressions, clicks, and conversions in both numerical and graphical formats.
This dashboard enables advertisers to:
✅ Assess campaign effectiveness at a glance.
✅ Identify trends and patterns based on historical data.
✅ Compare multiple campaigns within the same timeframe.
✅ Access deeper insights for optimization and strategic adjustments.
How to Use the Dashboard?
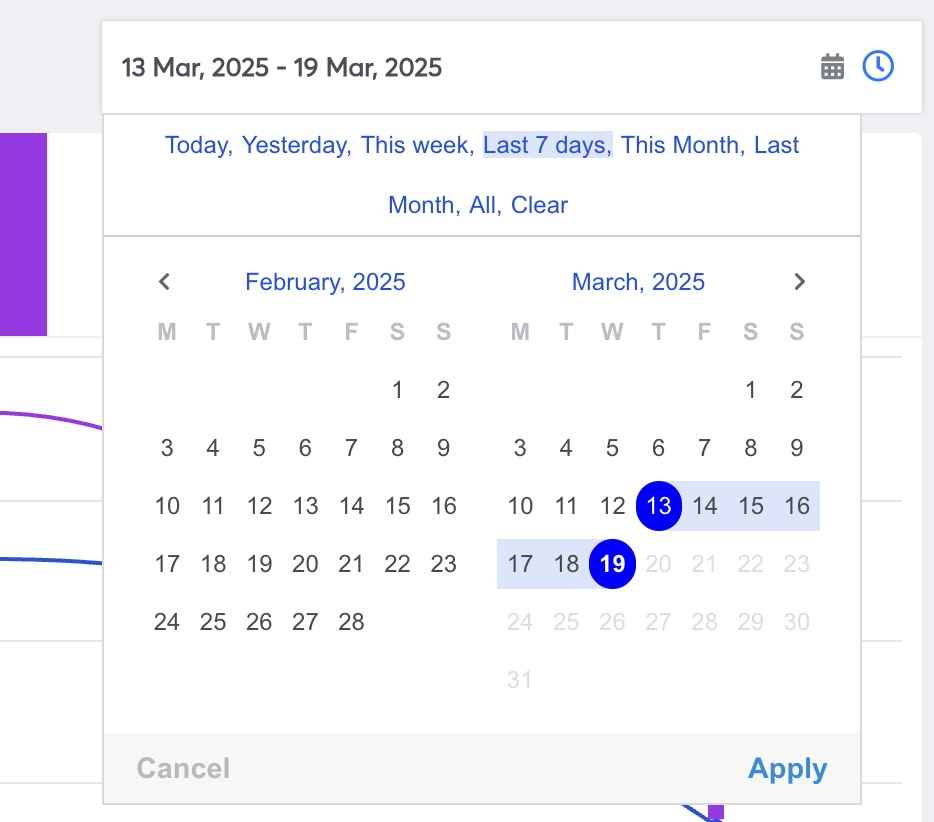
1. Selecting the Time Period
The Eskimi DSP Dashboard allows you to filter data based on a specific time range:
- Locate the time selection drop-down menu in the top-right corner of the page.
- Choose from pre-set time ranges (e.g., Today, Last 7 Days, Last 30 Days) or select a custom date range.
- Click Apply to refresh the data accordingly.
By adjusting the time filter, advertisers can focus on short-term or long-term campaign performance and identify seasonal trends.
2. Understanding the Dashboard Metrics
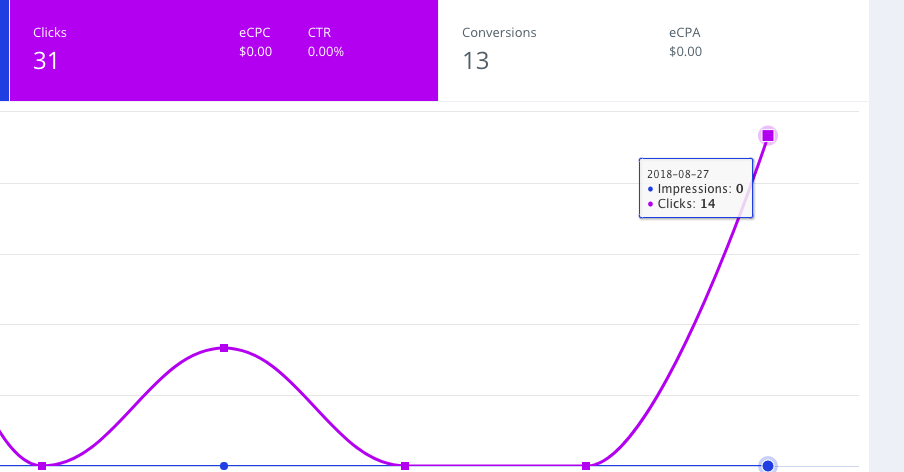
At the top of the dashboard, key performance indicators (KPIs) are displayed in numeric format, including:
- Total Spend – The amount spent on campaigns within the selected period.
- Impressions – The total number of times ads were displayed.
- Clicks – The number of times users interacted with the ads.
- Conversions – The number of desired actions completed (e.g., purchases, sign-ups, or downloads).
🔹 Visualizing Performance: Below the numeric KPIs, a graphical representation of the data helps identify trends over time.
- Hovering over the data points reveals precise values for impressions, clicks, and conversions on specific dates.
- The graph updates dynamically when the time range is changed, making it easy to track performance fluctuations.
- Scrolling further provides detailed visual reports with additional breakdowns for deeper analysis.
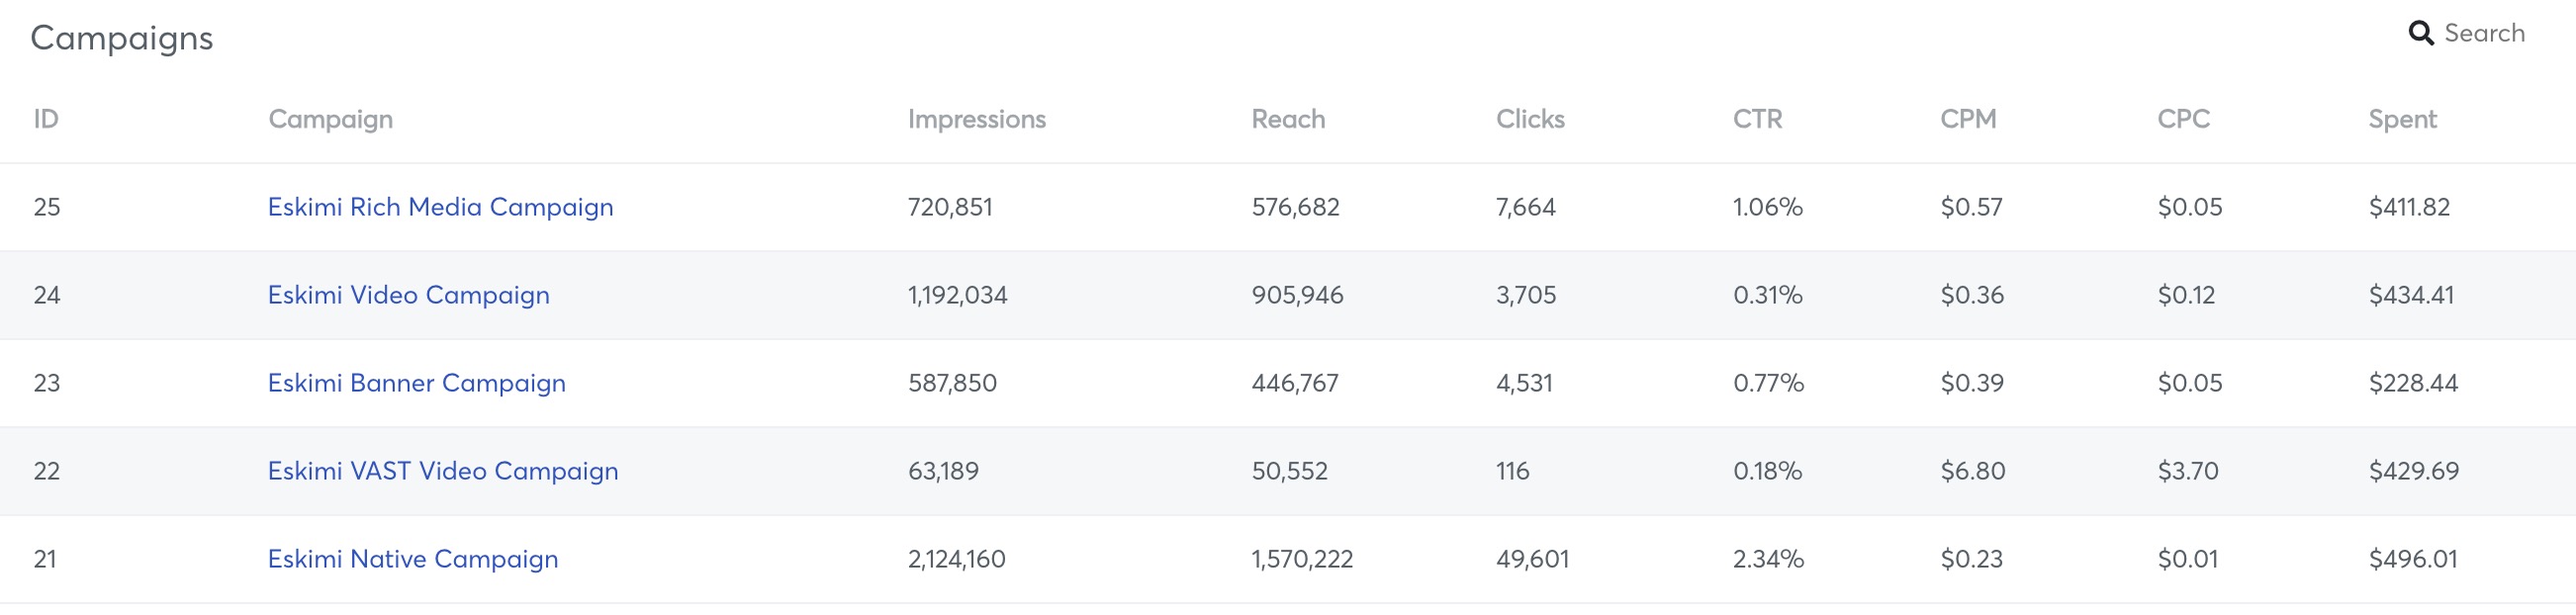
3. Active Campaigns Overview
Directly beneath the main dashboard metrics, a list of all active campaigns is displayed. This section provides advertisers with a quick overview of individual campaign performance.
🔹 Key features of the Active Campaigns list:
- Each campaign’s spend, impressions, clicks, and conversions are displayed.
- Clicking on a campaign name redirects users to its detailed Report page, where more granular insights can be accessed.
- Users can compare performance across multiple campaigns to determine which strategies are working best.
4. Additional Insights & Performance Breakdown
Further down the dashboard, advertisers can access in-depth performance analysis, including:
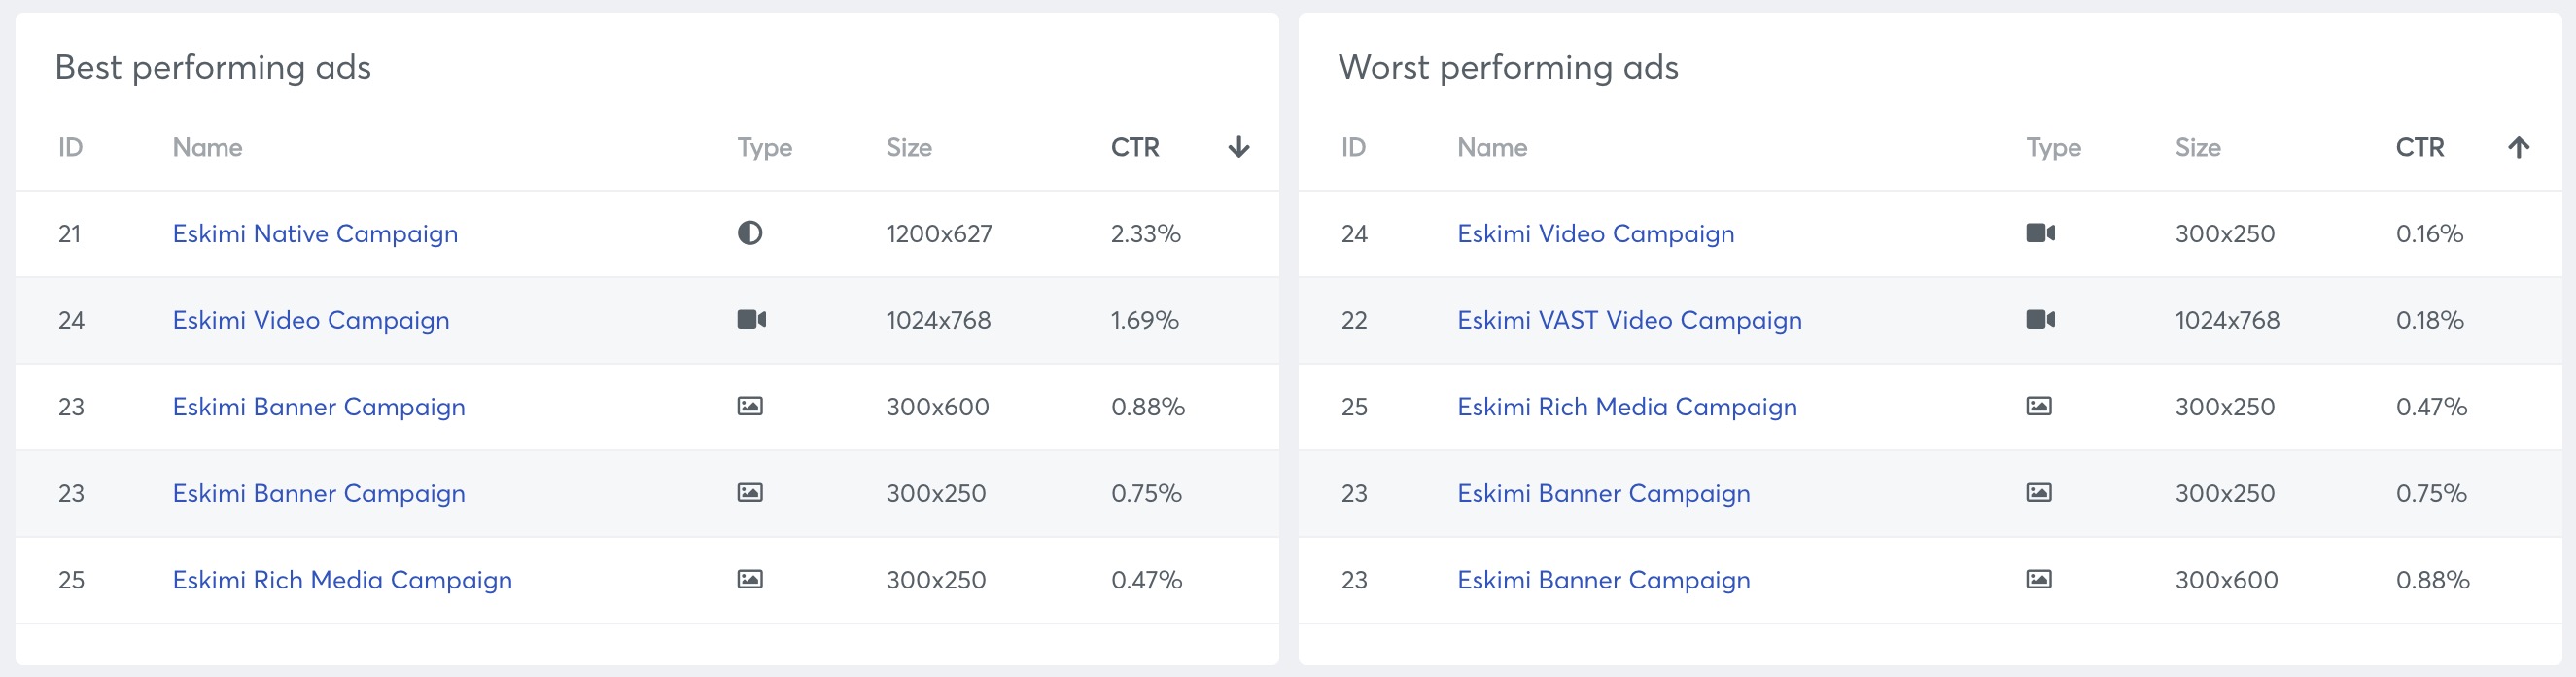
✔️ Best-Performing & Worst-Performing Ads
- Displays a ranked list of top and low-performing ads based on engagement, conversion rates, and other key metrics.
- Helps advertisers identify creative elements that resonate best with their audience.
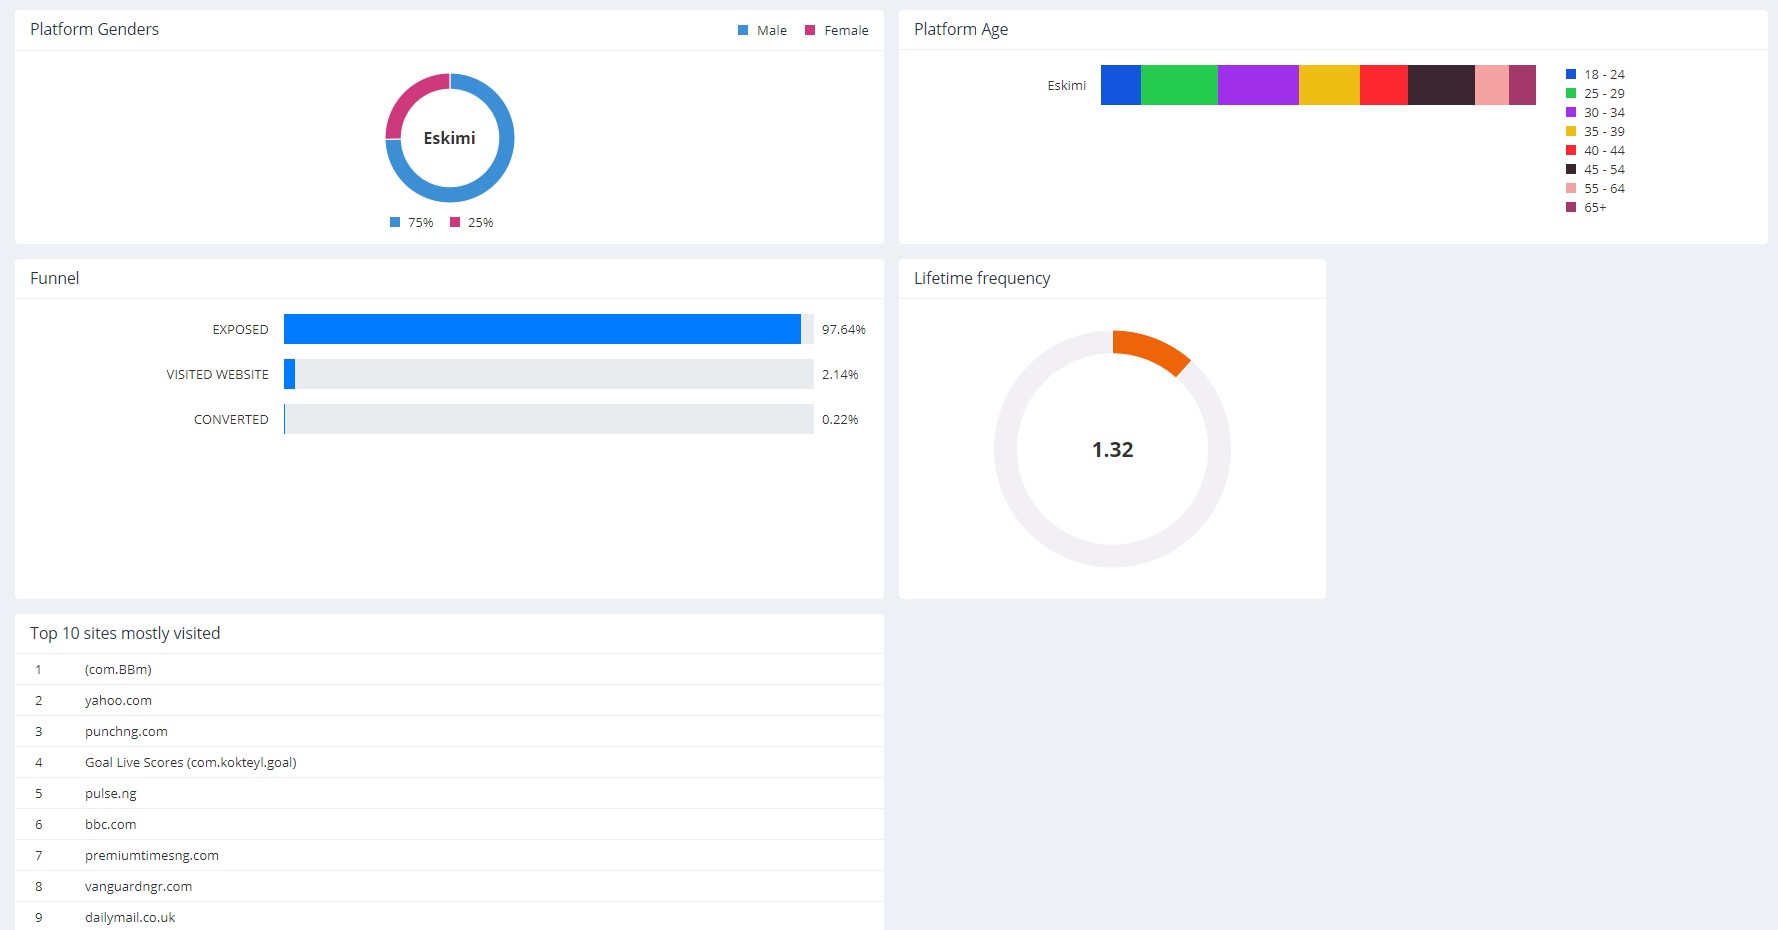
✔️ Platform & Operating System Distribution
- Shows which devices and platforms (mobile, desktop, tablet) are driving the most engagement.
- Breaks down performance by operating system (Android, iOS, Windows, etc.), allowing advertisers to optimize for the best-performing environments.
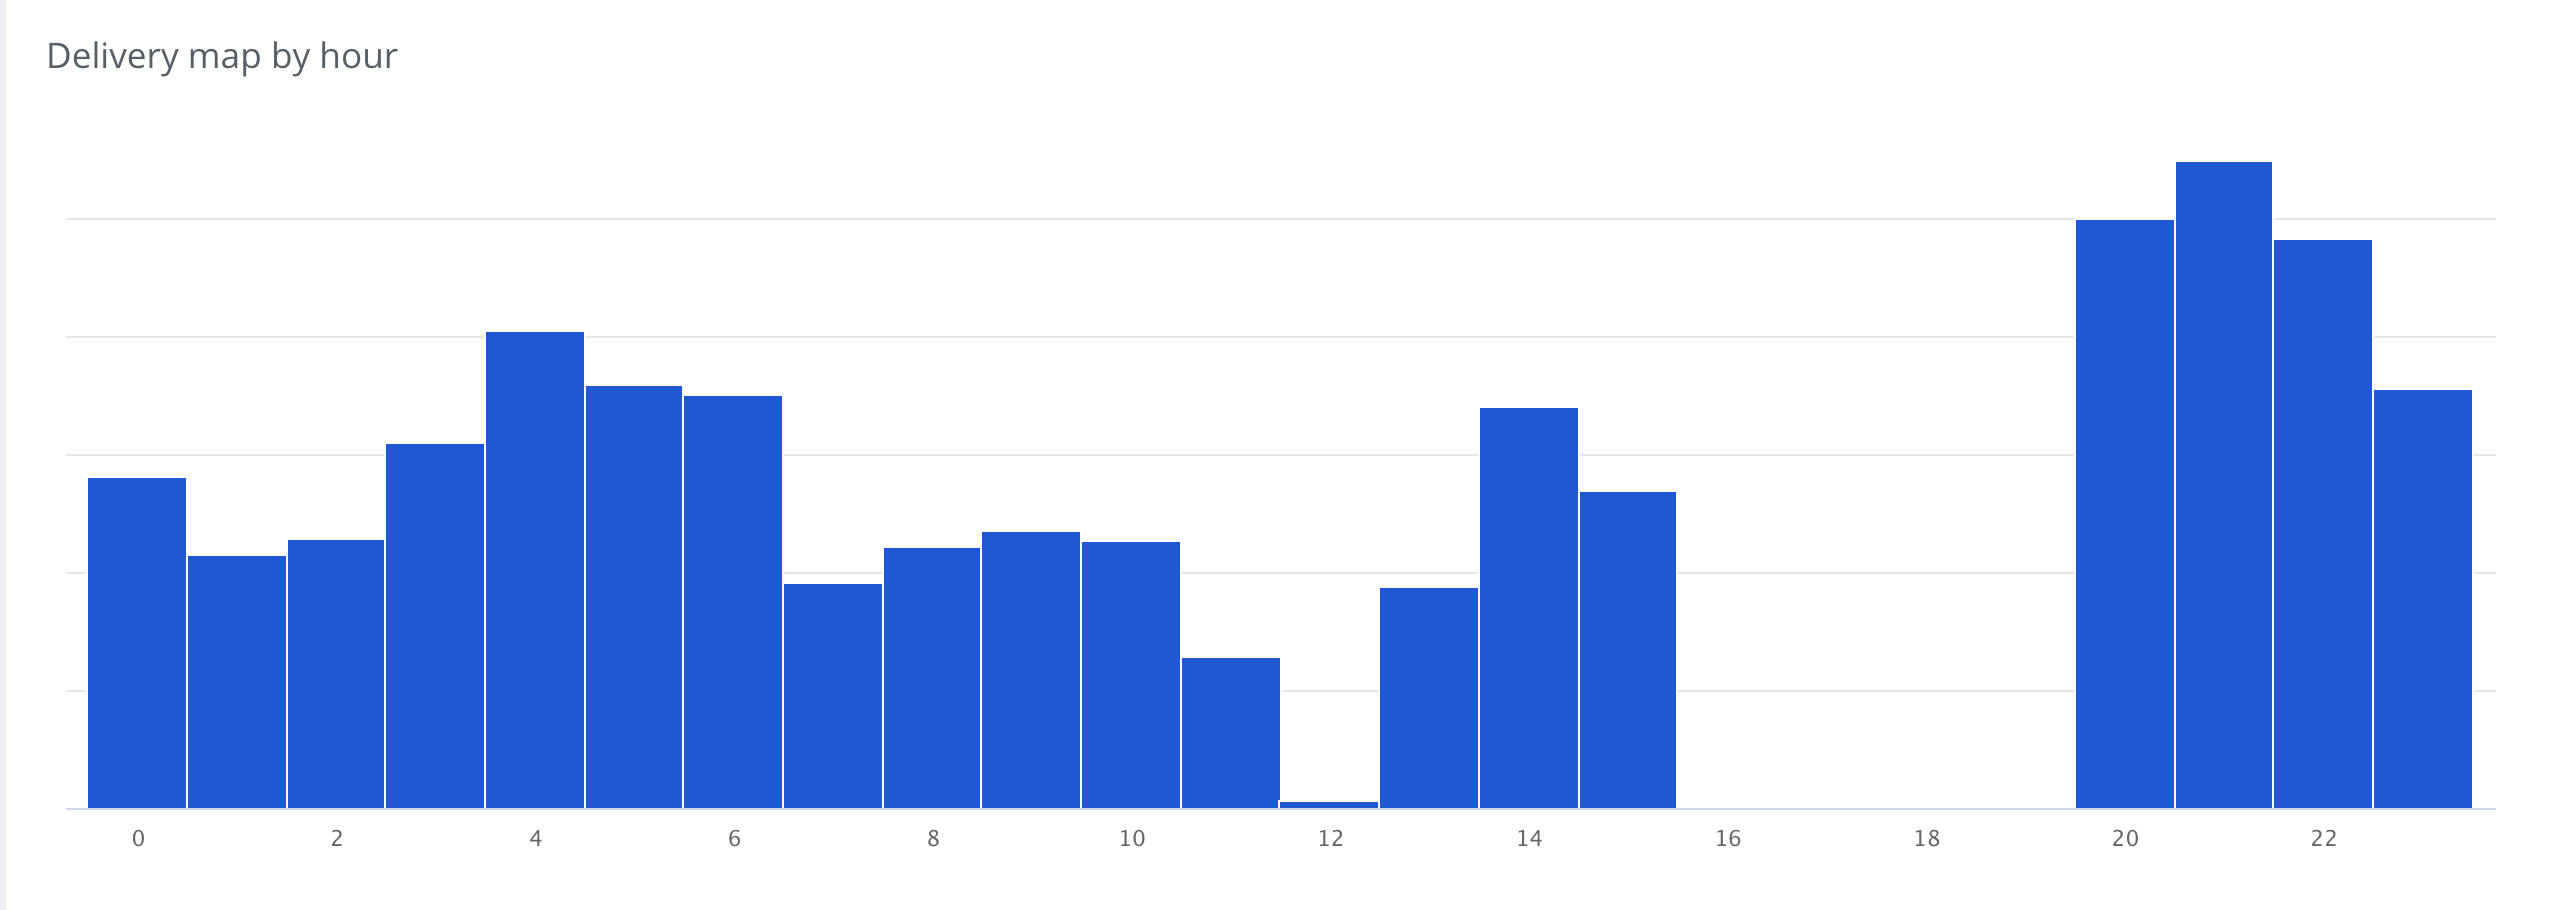
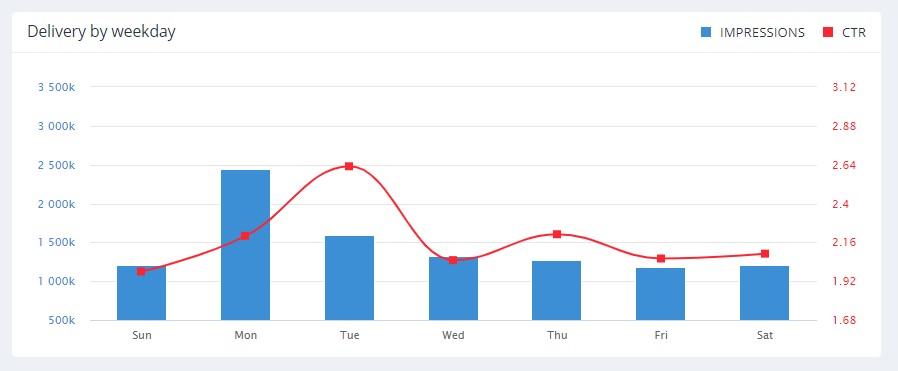
 ✔️ Delivery Map (By Hour or Weekday)

- A heatmap visualization displaying when ads receive the most impressions and interactions throughout the day or week.
- Helps advertisers optimize ad scheduling and budget allocation based on peak performance times.
Why Use the Eskimi DSP Dashboard?
The Eskimi DSP Dashboard is a powerful tool for campaign monitoring and optimization. By providing real-time insights and historical data, it enables advertisers to:
✅ Make data-driven decisions for better performance.
✅ Identify trends and adjust campaign strategies accordingly.
✅ Optimize ad placements, budgets, and targeting based on detailed reports.
By leveraging the Eskimi DSP Dashboard, advertisers can improve efficiency, maximize ROI, and refine their digital advertising strategies with ease. 🚀
Bounce Rate Optimization Via Eskimi DSP
When you’re advertising online, one of the key factors for successful ads is the quality of your website. If you’re trying to determine your website’s relevancy, Bounce Rate is the metric to follow. The importance of Bounce Rate as a measurement is that it shows how effective your website and marketing materials are. Bounce Rate measures visit quality. High Bounce Rate generally indicates that the site entrance (landing pages) aren't relevant to your visitors. Eskimi DSP gives the possibility to not only track Bounce Rate performance on Google Analytics via UTM tags, but to optimize the campaigns with the data collected. Therefore, we would like to share a few steps on how to export the necessary data to improve your digital campaign performance.
Bounce Rate Optimization Steps
Step #1: Go to the “Acquisition” section in your Google Analytics account.
Step #2: Go down to the “All Traffic” section.
Step #3: Click on “Source/Medium”.
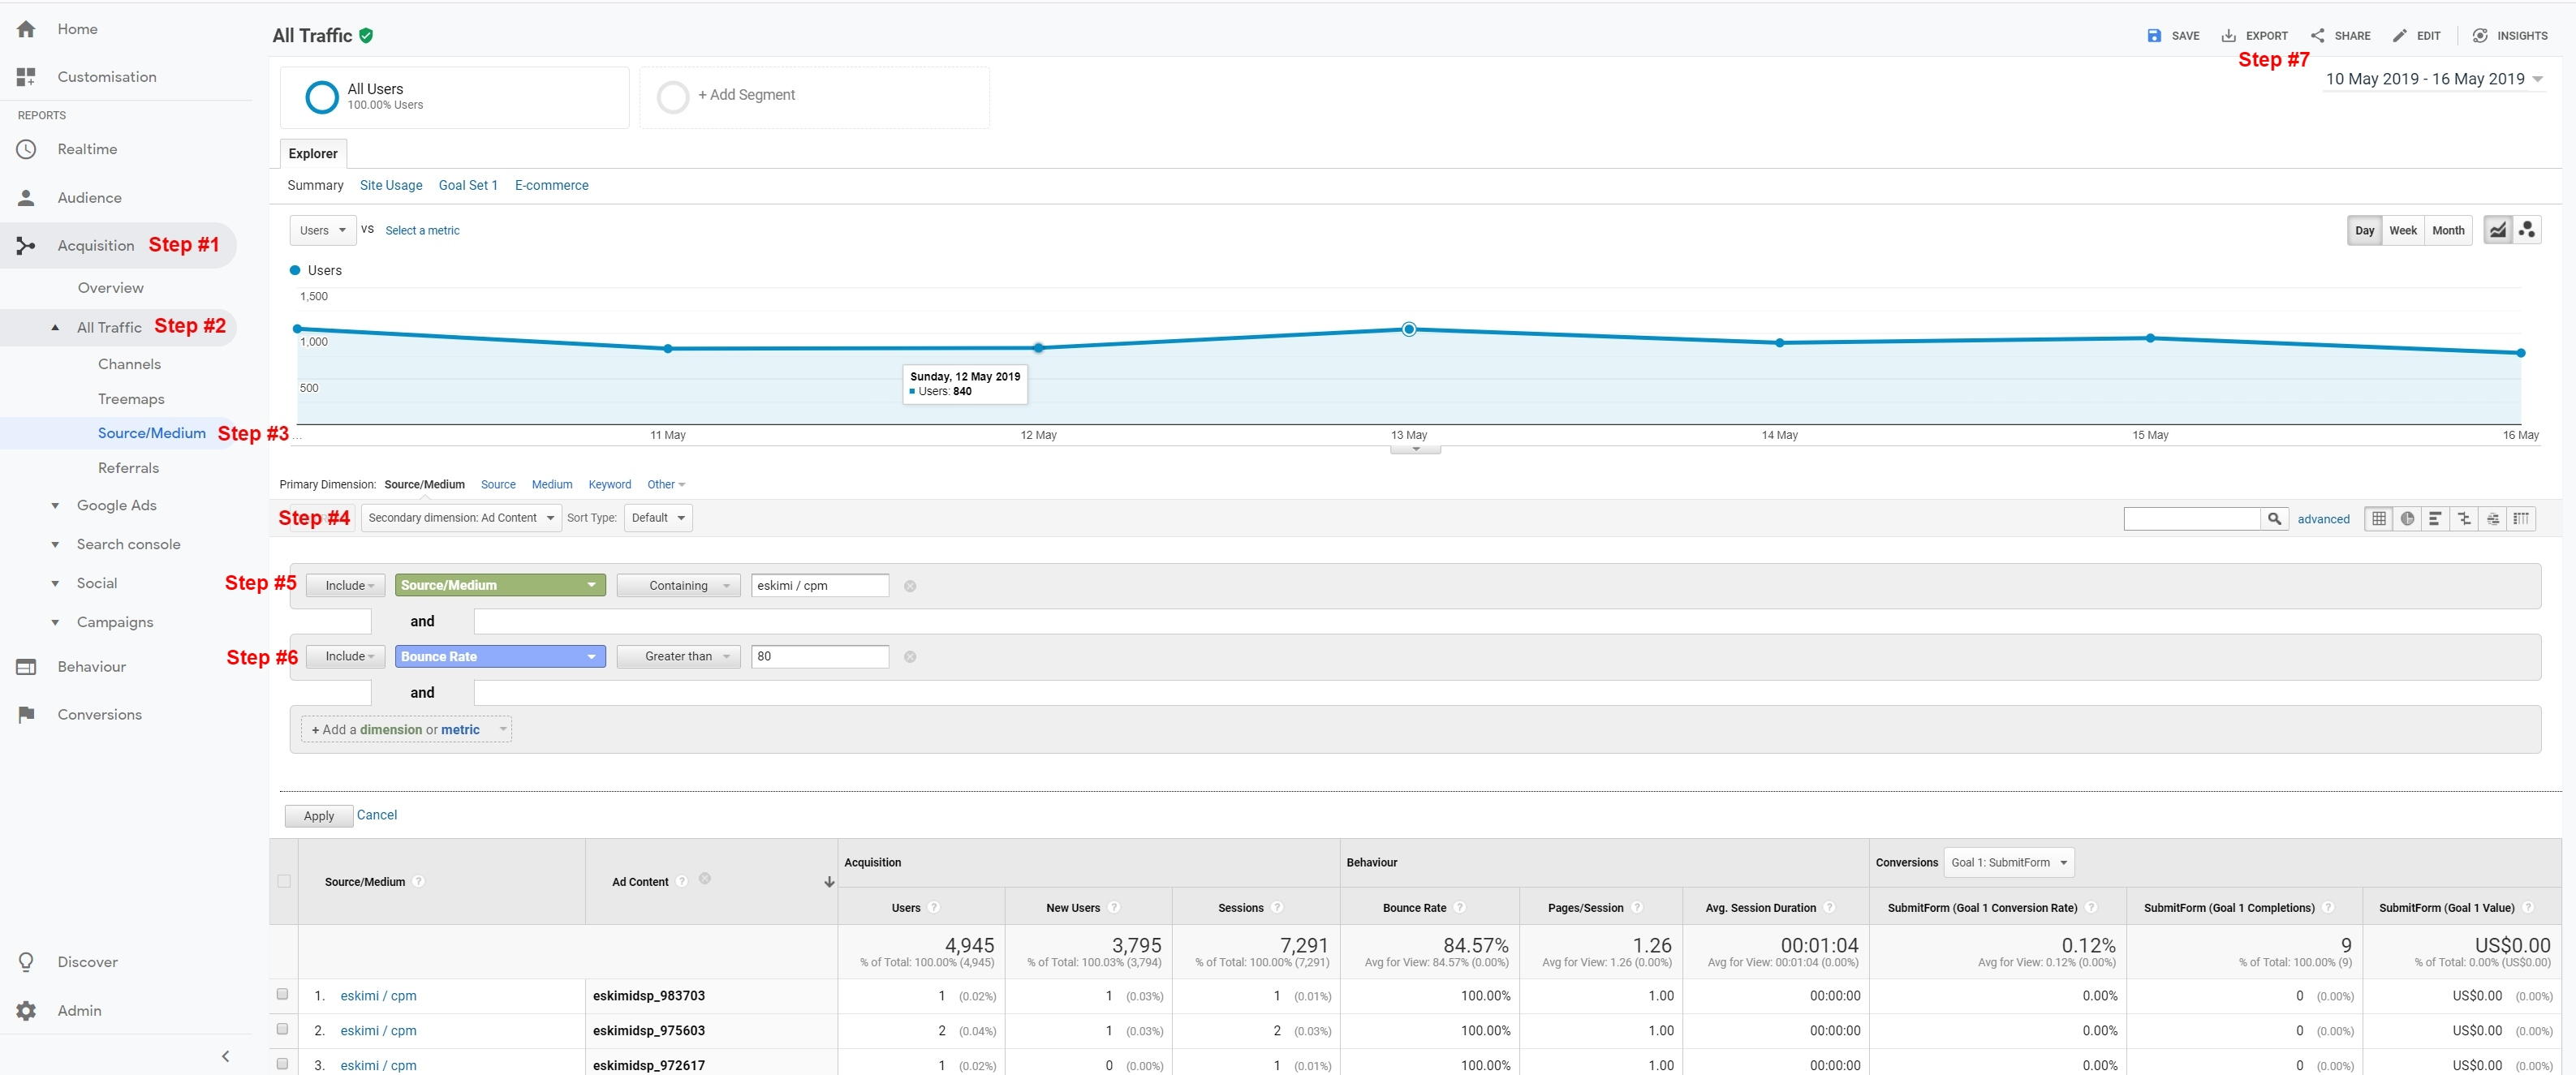
Step #4: Via “Secondary Dimension” section filter “Ad Content”.
Step #5: Include “Source/Medium” containing “Eskimi / CPM”.
Step #6: Include “Bounce Rate” greater than 80.
Step #7: Export the data to a CSV file.
After doing all the necessary steps, share the file with your personal ad-ops member. He or she will exclude the irrelevant placements, hence keeping good digital advertising hygiene.
Expectation vs. Reality: Clicks = Sessions?
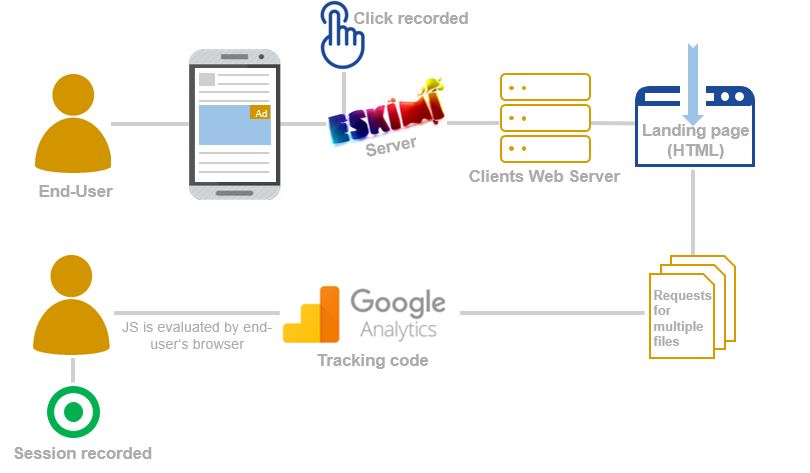
How often do you receive the question from the client: “Why Session volumes on 3rd party platform, Google Analytics, do not match clicks that the campaign has reached?” The question is a big head ace for advertisers. However, we wish to give clear answers and demolish the ongoing myth that Clicks = Sessions.
First, it is necessary to understand both concepts. Clicks indicate how many times your content was clicked by people while they were browsing online. Sessions, on the other hand, are a group of interactions that take place on your website within a given time frame.
Second, it is relevant to know the cause of the ongoing mismatch between different metrics. There are several reasons why these two numbers may not match:
Ads may be clicked multiple times. A user can click on an ad multiple times, but Google Analytics will only count these clicks as one session.
Returning users. A user can click on your ad, bookmark your site, and come back later during a different session. In this scenario, only one click would be recorded, while Google Analytics would recognize this as two separate sessions.
A user clicks and leaves quickly. A user may click on your ad but leave quickly by hitting the “back” or “stop” button before Google Analytics has a chance to load its tracking code and record the visit as a session. However, this would be counted as one click.
Session timeout. Google Analytics’ sessions are timed out after 30 minutes of inactivity. This means that if a user gets distracted and does something else during that time, then comes back and browses the site again later, it would be counted as two sessions.
Report overview and how to download it?
The report is a technical document, that details the diverse data collected during the campaign run. You can generate reports for a single campaign, as well as reports for all the campaigns under a particular account. To get more insights and analyse the performance of your campaign you can download reports directly from your Eskimi DSP account in several formats: .xls, .pdf, or .pdf (with charts).
Follow these simple steps to find the report.
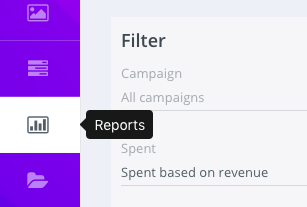
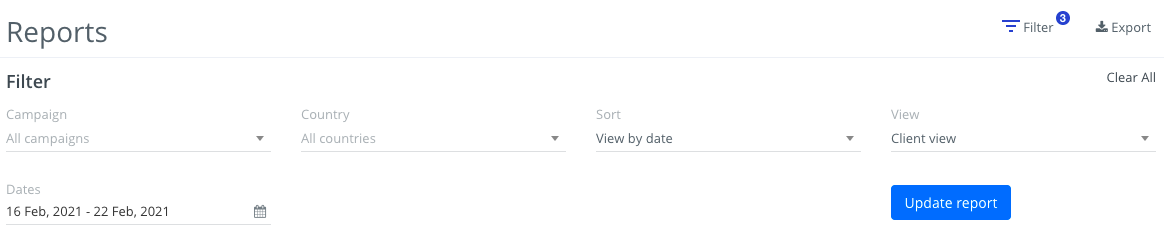
1. When you log in to your account, select the "Reports" menu on the left of your screen.
2. Customise your report based on the available filters.
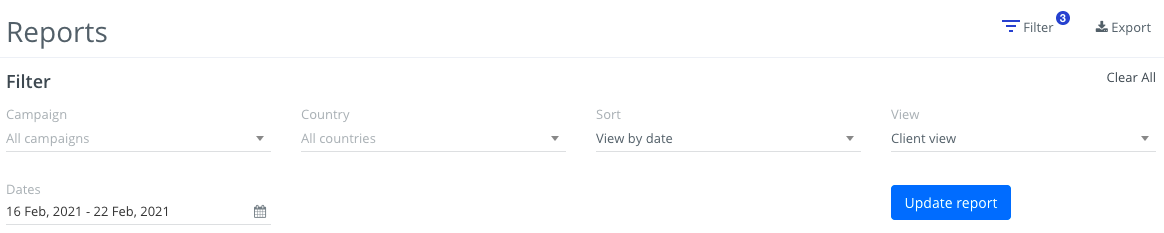
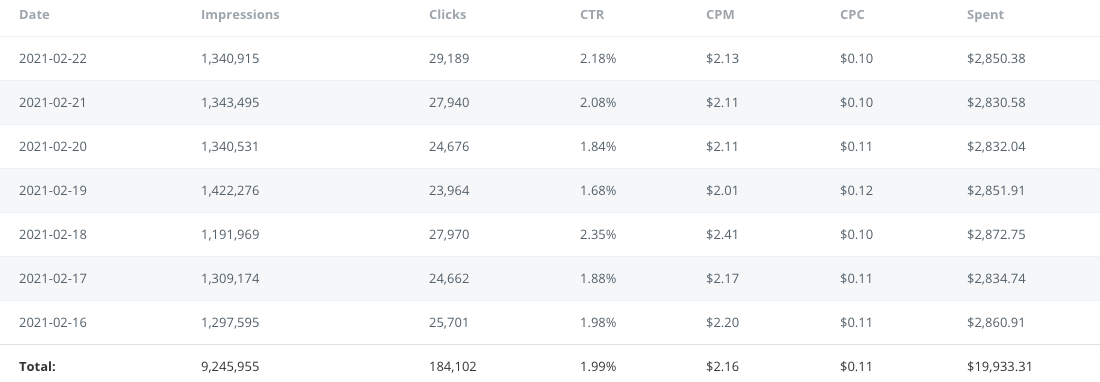
You can generate one report for all your campaigns or select a particular campaign. If you are running campaigns in several different countries, you can generate a report just for one of them by selecting the name of the country. You can choose the view of the report by date, by the campaign, or by country. Each of the filters is displayed in a convenient pop-up. And don't forget to choose the time period.
3. Now Scroll down and you'll be able to see the generated report together with data visualisation according to your selections. You can follow daily performance as well.
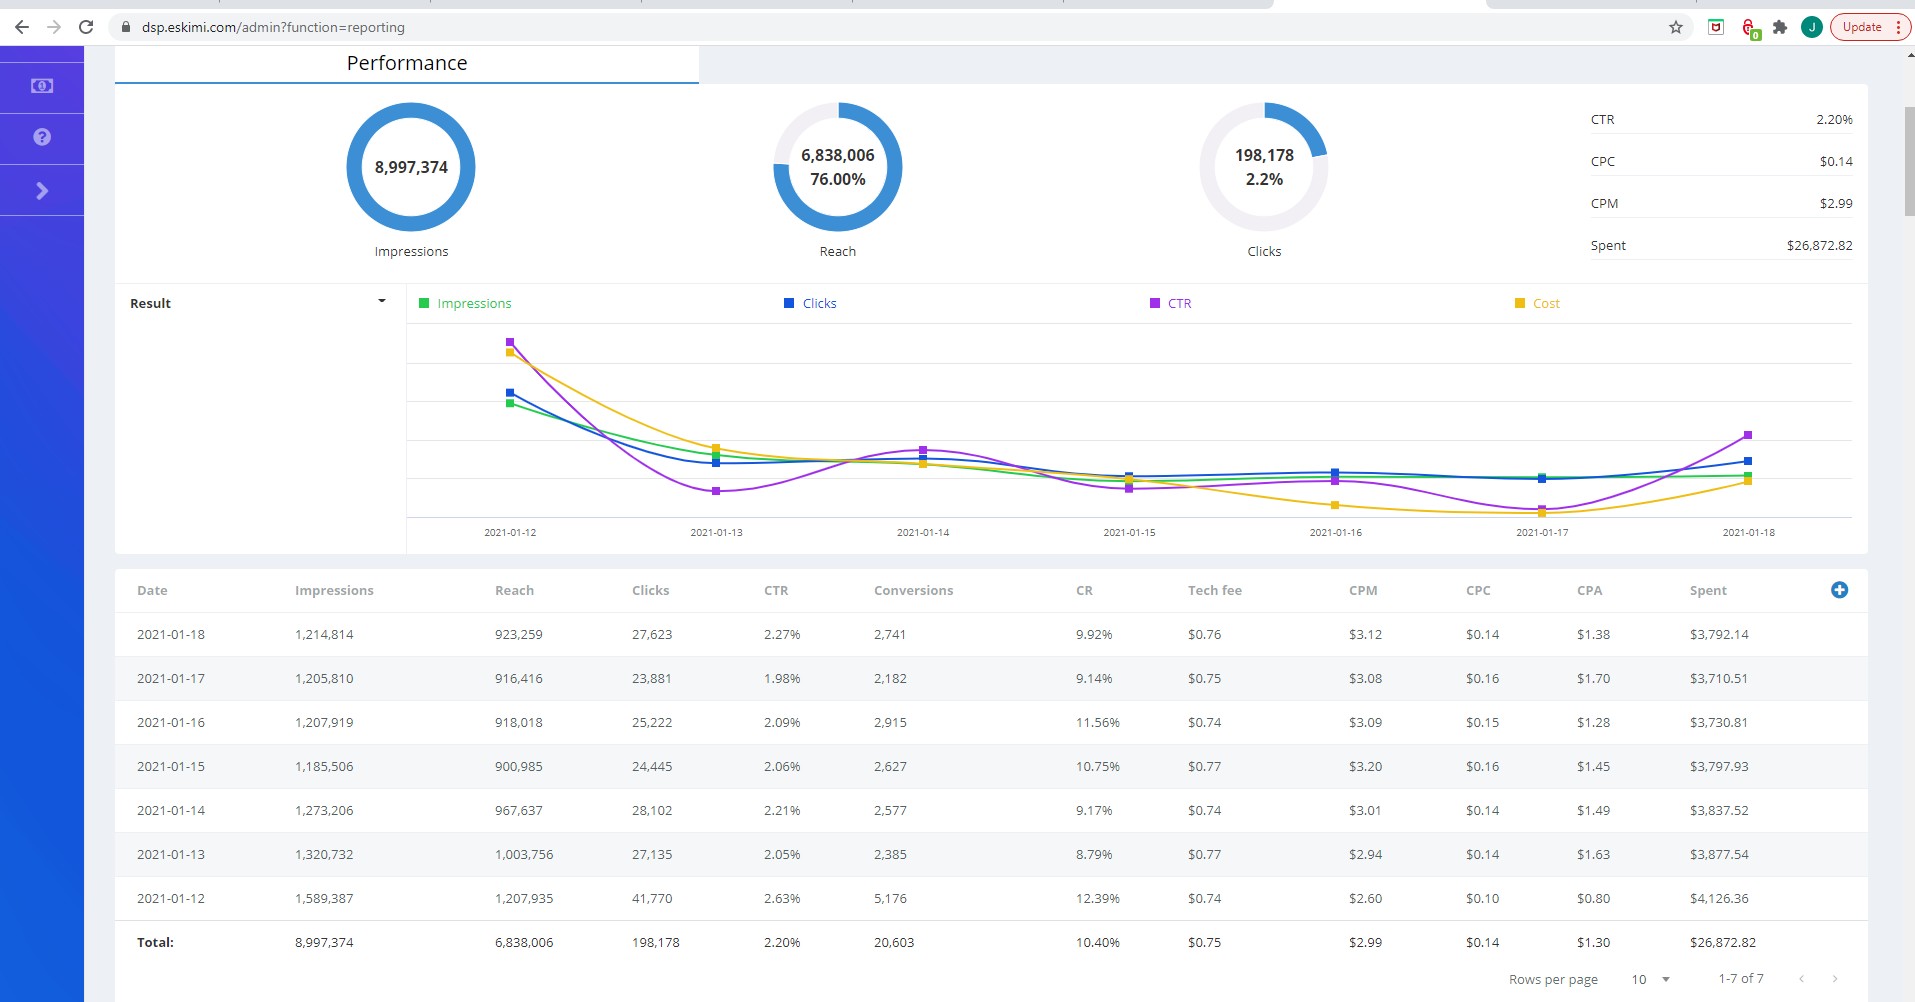
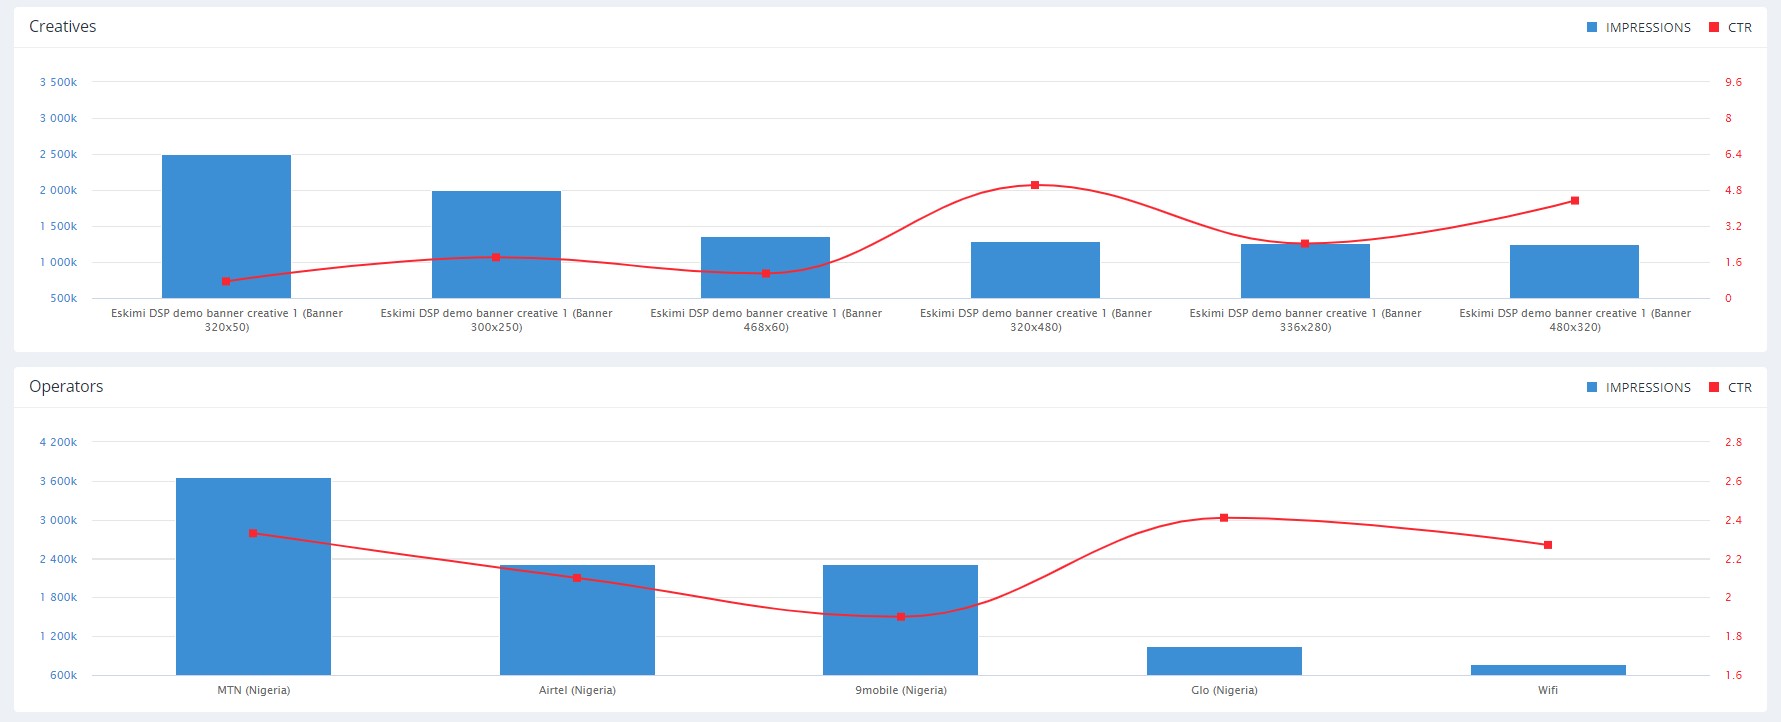
Scrolling down you will see insights about creatives, as well as technical insights ( operator, operating system, browser, device).
Time and placement performance shows campaign performance by weekdays.
There are many insights you can find on the report, if some of them are missing you can add missing filters by yourself.
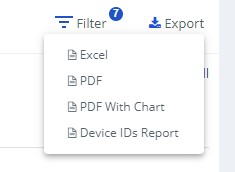
How to download the report?
You can download the entire report in 3 different formats: .xls, .pdf or .pdf with charts.
Go on the Eskimi DSP - Reports - select the particular account and campaign/s - on the right side look for the 'Export' button (picture below), each button corresponds to the format of the report.
Footfall
You may think that driving people to your website is the only use for online advertising – but did you know that if you have a physical shop, Eskimi Ads can be key in bringing more customers through your business’ front door?
Footfall is a marketing term used by retailers for describing the number of customers that enter their stores.
Footfall attribution is a method for correlating digital marketing campaign impressions with actual store visits.
The primary goal is to initiate offline user activity to your physical store/location.
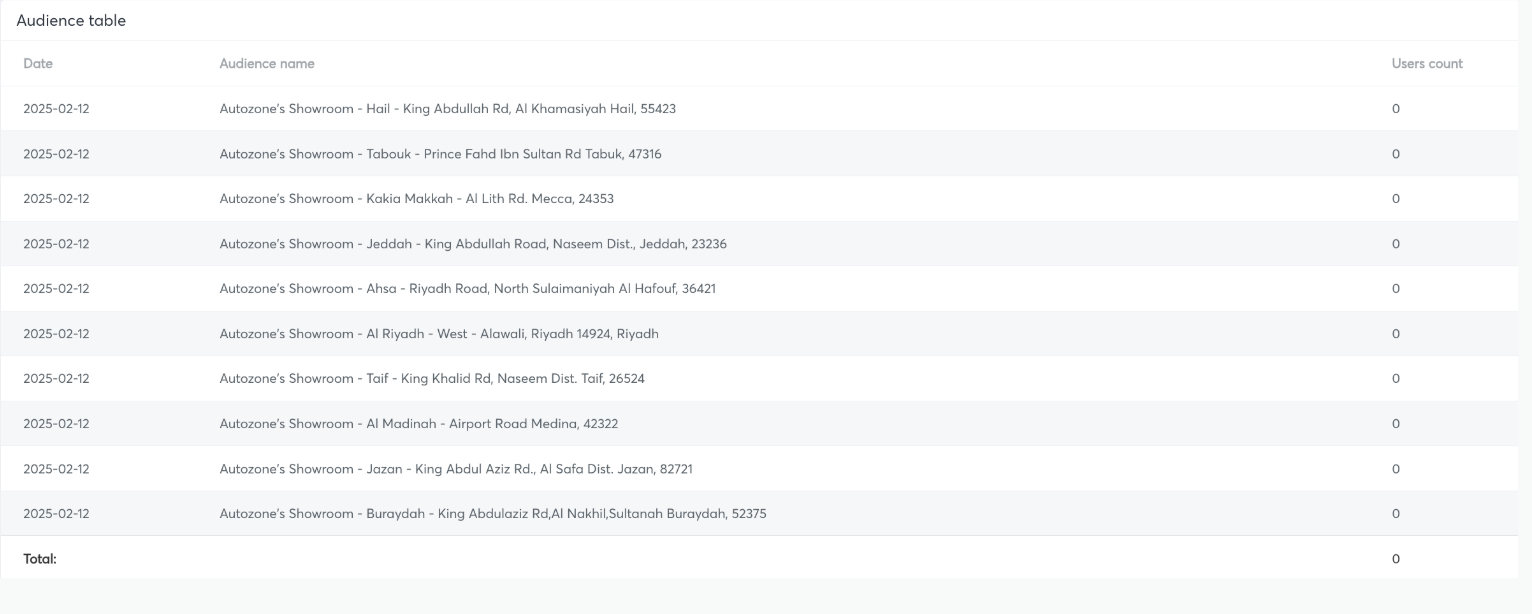
Footfall table example in the Eskimi DSP report (the footfall table is called Audience table)
Technology
Target users in different places. You can choose a wide range of targeting opportunities:
-
Country-wise - you can target the whole country. However, this may reduce the likelihood for people to visit your store if it in another part of the country.
-
Regional wise - this targeting would allow you to still reach a rather big amount of users, but it should bring better accuracy than country-wise targeting.
-
Radius targeting - To maximize the footfall results target users who are frequently next to your physical shop. Radius can differ depending on your goal, country, amount of shops, and other factors.
-
Other targeting opportunities - to reach good results the essential thing is to target app traffic. So you can use previous geofence audiences, impressions audiences from previous campaigns, interest audience and etc. Just don’t forget to enable only apps.
Footfall technology is based on various data segments. From which the primary is device IDs which is analyzed and compared from the users who have seen the ad and appeared in your physical store/location. Also, the solution takes into consideration real-time GPS location data. Meaning, that users are captured and analyzed in real-time.
Limitations - the majority of users will be reached on apps
Results
Eskimi DSP not only enables footfall measurement, but also helps your brand better understand the type of audience reached. It provides valuable audience insights based on the collected data and allows you to dive deeper into the results for a more comprehensive understanding of footfall performance.


|
Shop Name |
Total footfall users |
|
Shop 1 |
6,607 |
|
Shop 2 |
1,650 |
|
Shop 3 |
579 |
|
Shop 4 |
97,053 |
|
Shop 5 |
4,399 |
|
Shop 6 |
200 |
|
Shop 7 |
386 |
|
Shop 8 |
231 |
|
Shop Name |
Total Footfall Users |
Footfall Rate %* |
|
All Shops |
1,354,556 |
1.4% |
*Footfall rate is counted: users visited the shop / Total Reach

|
Traffic Source |
Footfall Users |
Footfall Rate % |
|---|---|---|
|
Region 1 |
44,555 |
1.21% |
|
Region 2 |
21,334 |
0.91% |
|
Region 3 |
10,341 |
0.56% |
|
Region 4 |
9,443 |
0.10% |
|
Traffic Source |
The Most Visited Shop |
|---|---|
|
Region 1 |
Shop 5 |
|
Region 2 |
Shop 1 |
|
Region 3 |
Shop 2 |
|
Region 4 |
Shop 4 |
These reports are provided as examples. Their level of detail depends on the campaign setup and segmentation. They are not automatically generated in the dashboard, but are prepared by our internal reporting team.
Media Planning
Budget: We strongly recommend starting from 10 000$. As with this budget, the client would receive the full package of footfall possibilities.
Audience Collection: Plan at least 2-3 days before the campaign launch for the audience collection.
Goal: Clearly understand the client’s objectives, what they aim to measure, and how they define success. Additionally, confirm whether they will track any metrics on their end.
Reporting: Inform the client that it will take up to 3 working days to prepare the report.
- Displays cross-matches between the targeted audience and the footfall audience.
- Displays the sum, not an overlap.
- The user can be cross-matched at any point in time after the ad is seen.
- Footfall reach shows users in sum, not unique users.
- The user will be calculated continuously every time he/she visits the location after seeing the ad.
Visits
Click to visit tracking is a helpful tool for optimising the visits, click to visit rate (CVR) or cost per visits (CPVst).
Visit metric measures the number of users who successfully arrive at an advertiser's website or landing page after interacting with an ad through a click.
Visit is counted:
- First second when user lands to campaign landing page and Eskimi DSP pixel fires
PROCESS:
1. SETUP
Setup Eskimi DSP Tracking pixel on the landing page.
1. Obtain the Tracking pixel code from Tracking pixels section.
2. Place the Tracking pixel code on the landing page.
More information about tracking pixel implementation guide
2. COLLECT
Collect click to visit data after launching the campaign and receiving clicks.
Collect the data to Eskimi DSP campaign reporting system: Visits, CVR (click to visit rate), CPVst (cost per visit).
3. OPTIMISE
Optimise only manually.
- Optimise manually on Targeting optimisation tool by Ad exchange, Creative, OS, Browser, Operator, App/Site.
Engaged sessions
Click to engaged session tracking is a helpful tool for optimising the sessions, session rate (SR) or cost per session (CPS).
ENGAGED SESSION definition - engaged session is a group of user interactions on the website that take place within a given time frame.
Engaged session is counted if:
- 2 or more page views were made
- The user spends 10s or more on the site
It's important to note that the engaged session differs from session.
PROCESS:
1. SETUP
Setup Eskimi DSP Tracking pixel on the landing page.
1. Obtain the Tracking pixel code from Tracking pixels section.
2. Place the Tracking pixel code on the landing page.
More information about tracking pixel implementation guide
2. COLLECT
Collect click to engaged session data after launching the campaign and receiving clicks.
Collect the data to Eskimi DSP campaign reporting system: Engaged Sessions, SR (engaged session rate), CPS (cost per engaged session).
3. OPTIMISE
Optimise automatically or manually.
- Optimise automatically by setting up rules for SR (engaged session rate) or/and CPS (cost per engaged session).
- Optimise manually on Targeting optimisation tool by Ad exchange, Creative, OS, Browser, Operator, App/Site.
Reporting filters - what and how to check?
Customise your report based on the available filters.
You can generate one report for all your campaigns or select a particular campaign. If you are running campaigns in several different countries, you can generate a report just for one of them by selecting the name of the country. You can choose the view of the report by date, by the campaign, or by country. Each of the filters is displayed in a convenient pop-up. And don't forget to choose the time period.
Filters
1. Campaign
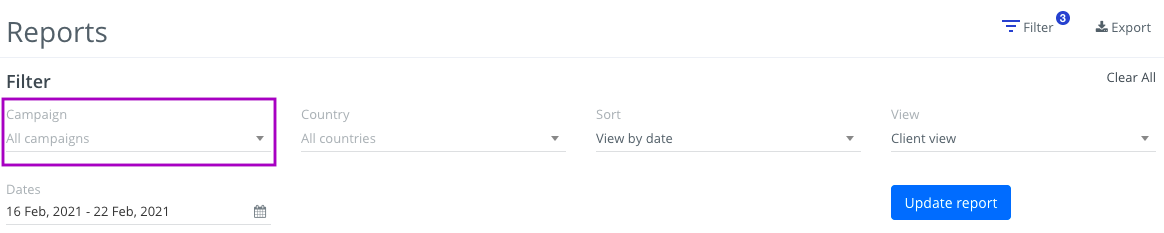
- If you're running few different campaigns and want to see results few campaigns results, you need to select those particular campaigns.
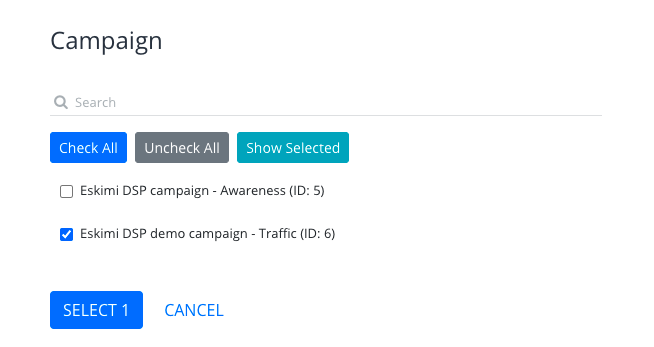
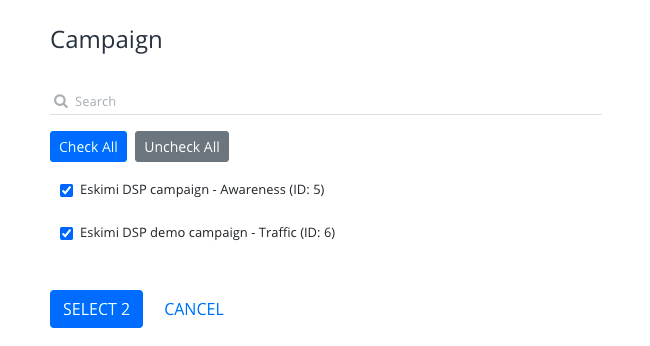
You can search campaign by campaign name, once you select campaigns what you wanted to check - click "Select" and "Update report".
2. Country
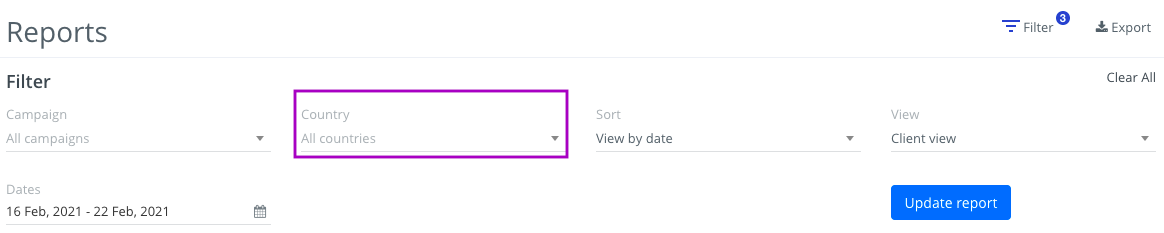
- If you are running campaigns in several different countries, you can generate a report just for one of them by selecting the name of the country.
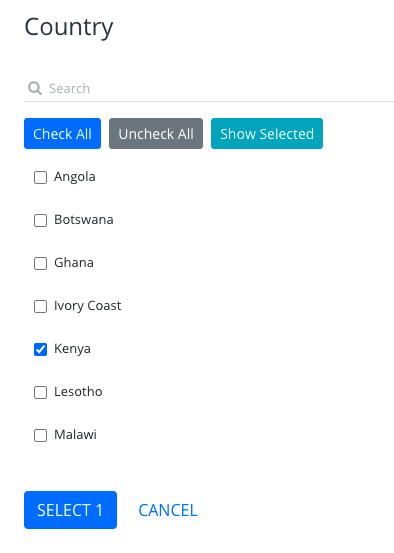
With such filter you will see results of campaigns which are running only in Kenya.
3. Sort

With this filter you can choose the view of the report by date, by the campaign, by country or by platform.
Sort by date:
There you see the results by selected time period:
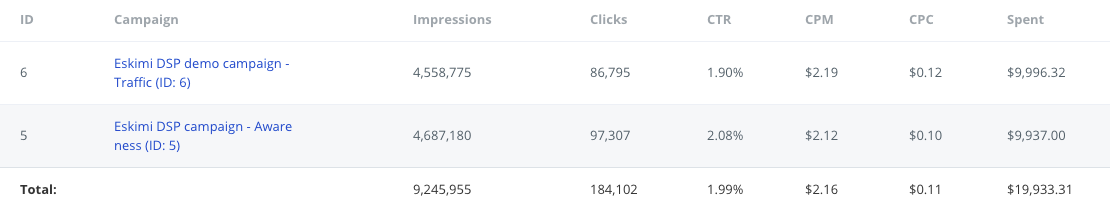
Sort by campaign:
There you see the results by selected campaign:
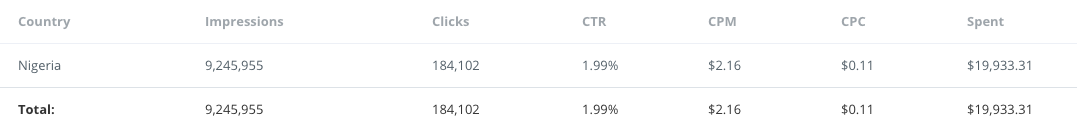
Sort by country:
There you see the results by selected countries:
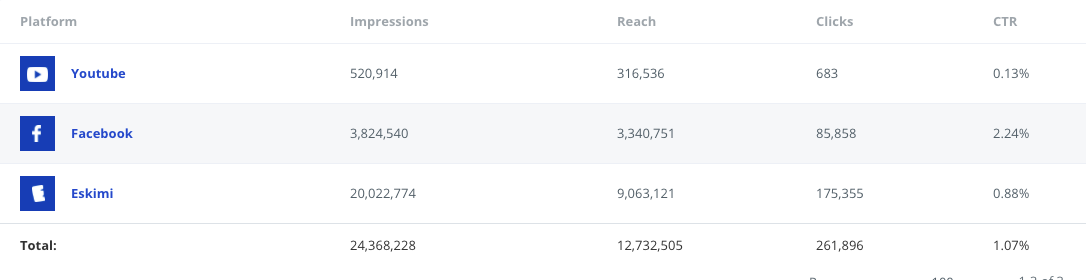
Sort by platform:
If you're running Multichannel campaign, there you're able to see campaign results by each platform.
4. Dates
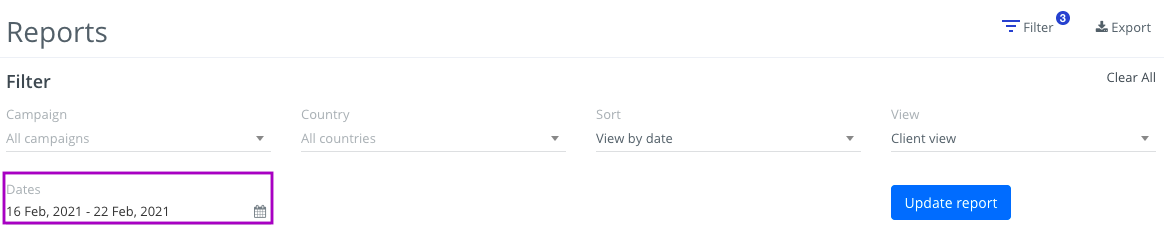
There you can choose the time period of the campaign.
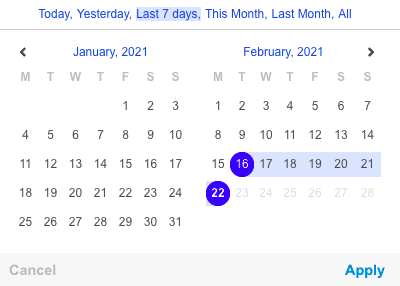
You can select and check Today, Yesterday, Last 7 days, This Month, Last Month data in the report, or you can manually select the dates. Once it done - do not forget click "Apply" and "Update report".
Looker Studio integration (external)
Introduction:
Eskimi offers a basic integration option with Google Looker Studio, enabling the transfer of fundamental metrics such as impressions, spend, and clicks. However, advanced data points, including media spend or top-performing creatives, are not currently supported.
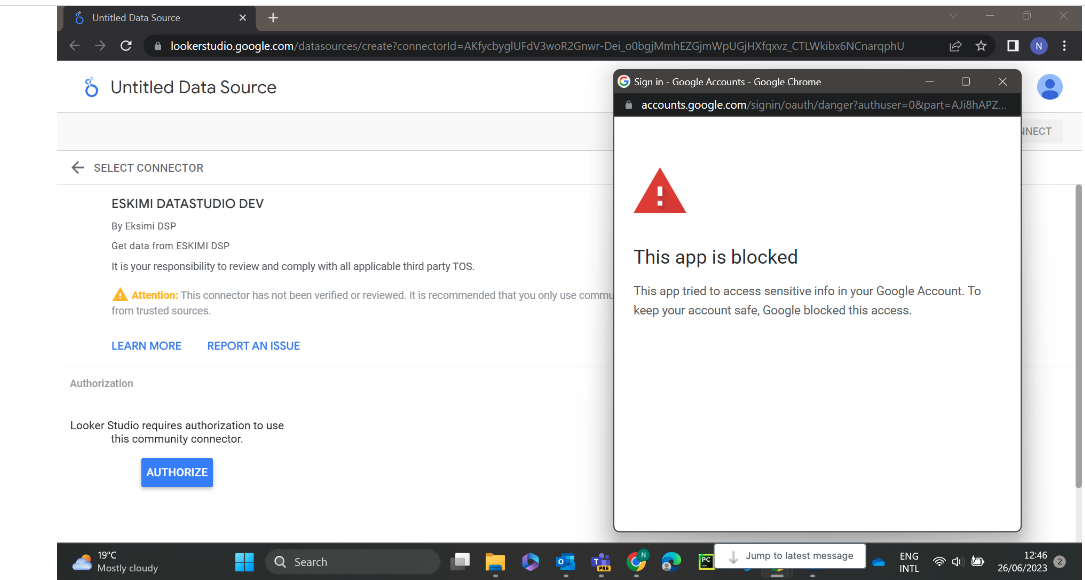
Additionally, our Looker Studio code has not been officially approved by Google, as the approval process is both lengthy and resource-intensive. To date, Eskimi has not identified a strong need to pursue this certification. As a result, external users attempting to connect to Looker Studio may occasionally encounter the following error:
If you encounter this error and are unable to bypass it to connect to Looker Studio, there is no alternative workaround available. The only solution we can offer in such cases is to create a custom Looker Studio report tailored to the specific splits required by the user. Should this approach be chosen, the report will need to be built by our team, which may take some time. Additionally, users will not have the ability to independently add or modify splits within the report.
Guide:
To obtain the Looker Studio connector URL, you will need to provide an email address with access to the connector (this must be a Gmail domain). Once the Eskimi team has created the connector, the URL will be sent to the provided email.
Upon accessing the connector, you will likely encounter the following window:
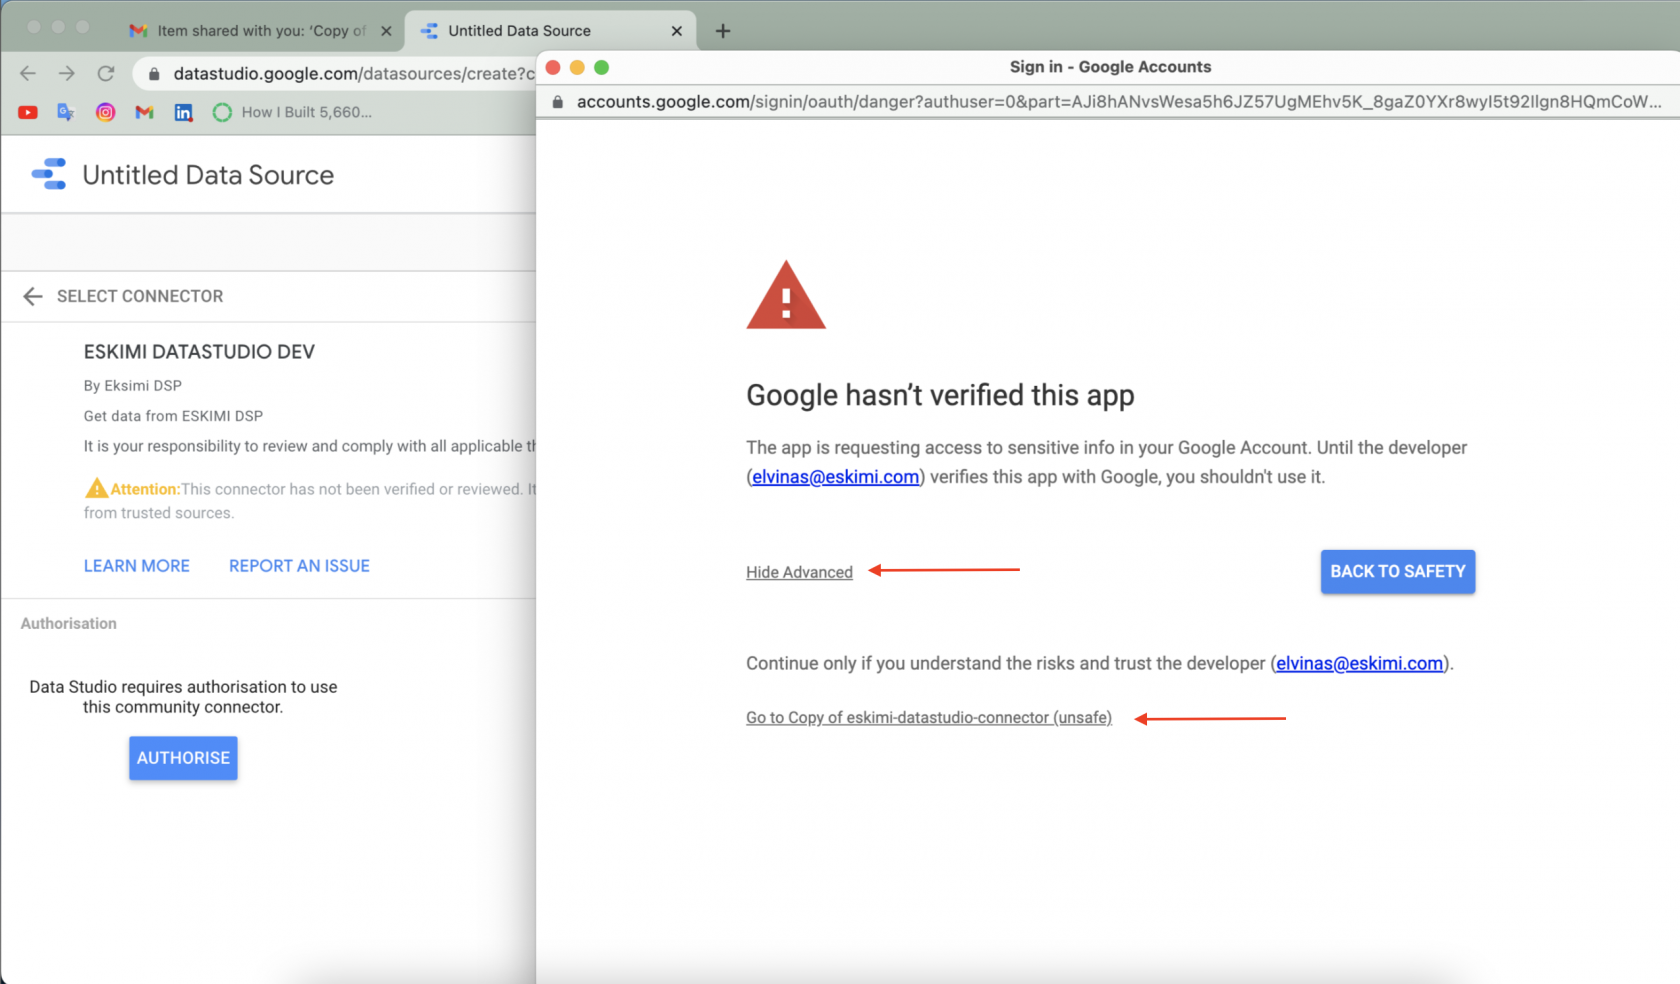
You will have to click on "Hide" -> "Go to Copy of eskimi-datastudio-connector (unsafe)" -> Authorise (and authorise the connector with your gmail account to witch the access was shared).
If you will encounter the error that was mentioned in the "Introduction part" sadly there is no way to bypass it, and the only other is option to go with Looker Studio custom report.
If everything goes well, after Authorising the connector you will see this window:
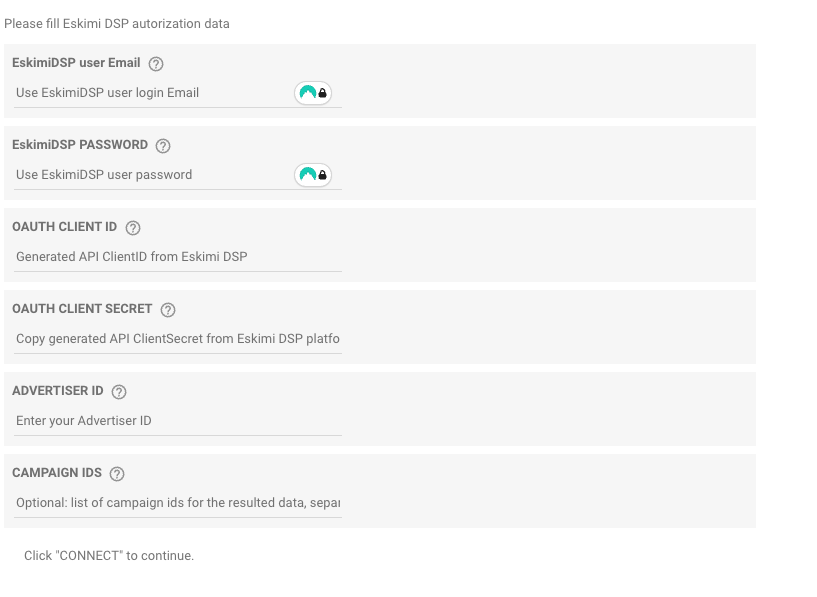
*CAMPAIGN IDS - Here you can enter separate account Campaigns ID’s for which you want to obtain the data, has to be separate with the ; symbol. If you leave the campaign field empty it will take the last 15 campaigns from the account.
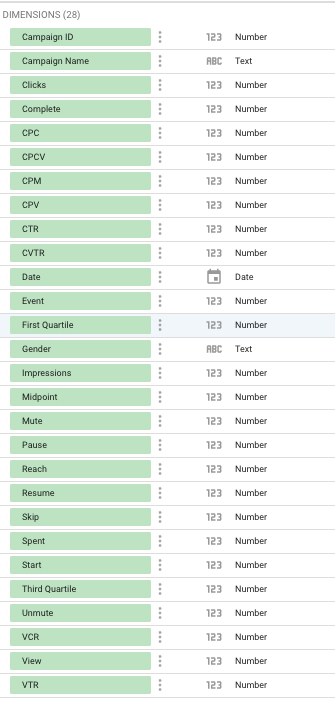
Data points you can access with the Looker Studio connector:
Please use the fields as Dimensions to avoid data discrepancies
Filtered Impressions
The Filtered Impressions widget is a helpful tool that shows the percentage of impressions that were filtered out from your campaigns. This can happen due to multiple reasons, such as specific targeting settings, creatives, budget & pacing limitations, and more. The percentage displayed indicates the number of impressions that didn't meet the specified criteria and were therefore excluded from the campaign.
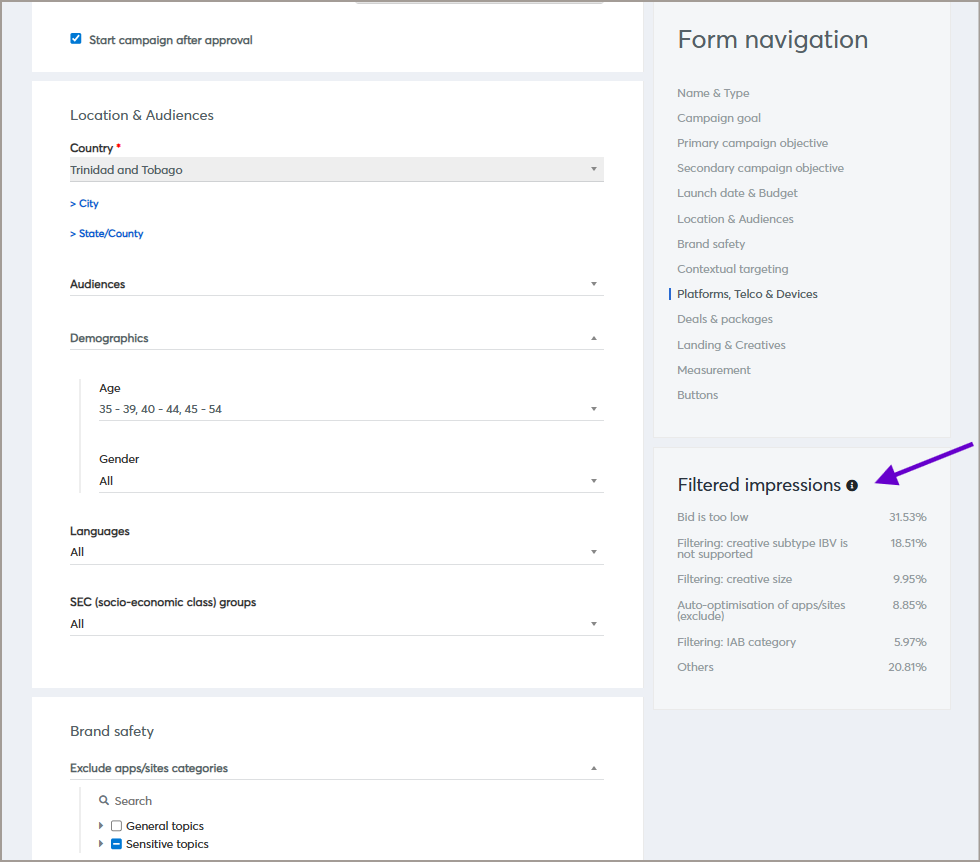
Impressions can be filtered for the following reasons.
Pre-bid
The number of impressions not bought due to a pre-bid issue:
- Invalid traffic. Number of queries that were filtered because they are considered invalid traffic, e.g., fake clickers.
- Unauthorized seller (Ads.txt). Number of queries that were filtered because they are from Unauthorized Sellers.
- Rewarded ads are not supported. Number of queries that were filtered because the requests contain rewarded ads that are not supported.
Targeting
The number of impressions that were filtered due to targeting settings on your campaigns.
|
Targeting Setting |
Description |
|
Ad placement position |
Impressions that did not match ad positions selected in the campaign, e.g. above the fold. |
|
SEC & LSM |
Impressions that did not match the SEC & LSM targeting selected in the campaign. Read more here. |
|
Audience |
Impressions that did not match the audience targeting options used in the campaign, e.g., DMP audience or retargeting audience. |
|
Device |
Impressions that did not match the device targeting used in the campaign. It could be related to device type, OS, brand or model. |
|
Browser |
Impressions that did not match the targeted web browser in the campaign. |
|
Environment |
Impressions that did not match the environment (apps or sites) targeting options used in the campaign. |
|
Operator/ISP |
Impressions that were excluded due to operator/ISP targeting options used in the campaign. |
|
Location |
Impressions that did not match the location targeting of the campaign, e.g. country, cities, states, or zip codes. |
|
Language |
Impressions that were excluded due to language targeting options selected in the campaign. |
|
Brand Safety |
Impressions that did not match one or more brand safety settings set up in the campaign. |
|
IP addresses/ranges |
Impressions that did not match the targeted IP address or ranges of the campaign. |
|
Categories |
Impressions that did not match the app/site categories selection of the campaign. |
Creatives
The number of impressions that were filtered due to issues with the creatives selected in the campaign.
Display creative aspects
- Native ad is not SSL compliant. Impressions filtered due to non-SSL content, such as landing pages or third-party trackers using HTTP instead of HTTPS protocol.
- Banner JavaScript is not supported. Impressions that are filtered because JavaScript is not supported. This can be related to rich media, or JavaScript creatives and ad exchanges that don’t support JavaScript tags.
- Native ad asset is invalid. Native video creative image sizes are not suitable for native format alternative images.
- Video ad companion is not supported. Impressions are filtered because the potential placement does not support the companion banner.
- Banner topframe. Impressions that are filtered due to selected top frame placement targeting.
Video creative aspects
- Video ad skip is not supported. Impressions that are excluded due to placement limitations for selected video ad skip ability options.
- Video ad VPAID or OMID is not supported. Impressions that are filtered due to selected viewability tracking methods in creative settings. Learn more about VPAID or OMID.
- Video ad max duration exceeded. Impressions that are excluded because the video creative exceeds the allowed duration limit.
- Video ad VAST version is not supported. Impressions that are filtered due to the uploaded VAST tag version.
- Video ad start delay is not supported. Impressions that are filtered because of the start delay option that is applied in creative settings.
- Video ad min duration is not reached. Impressions that are filtered due to too-short video creative duration.
- Video ad MRAID is not supported. Impressions that are filtered as the placement does not support MRAID. Not all apps support MRAID, meaning that the impressions from the ones that don’t support it are getting filtered.
- Video placement. Impressions that are filtered due to selected video player placement (e.g., in banner, in article, in feed, interstitial, etc.).
- Video Linear/In-Stream placement. Impressions that are filtered due to selected video player requirements related to Linear/In-stream placements.
Placement limitations
- Creative category is not allowed. Impressions that are filtered due to a restricted creative category.
- Creative is not approved. Impressions that are filtered as the selected creative is pending approval or was rejected by the ad exchange.
Publisher restrictions
- Click URL excluded by publisher. Impressions that are filtered due to the declared click URL, which is excluded by the publisher.
- Product category excluded by the publisher. Impressions that are filtered due to detected sensitive advertised product category.
- Sensitive category excluded by the publisher. Impressions that are filtered due to the detected sensitive creative content category.
Budget & pacing
The number of impressions meeting targeting criteria with eligible creatives, but with bids exceeding any of the following limits:
- Frequency capping. Can be set on a campaign level. If the impressions limit for a user for a given period is reached, further impressions will be filtered out for the given period.
- The bid is too low. The bid price falls below the floor or exchange/publisher minimum price in an open auction. Increasing the bid might help to improve campaign performance by allowing the campaign to bid on placements with higher bid floors.
Reach Calculation on Eskimi DSP
Our DSP (Demand-Side Platform) includes a reporting system designed to track various metrics such as bids, impressions, and clicks. One important feature is the ability to calculate unique reach—the number of distinct users exposed to an ad—over time or throughout a campaign.
To achieve a balance between cost efficiency and performance, our platform uses Redis’s HyperLogLog (HLL) data structure for estimating unique reach. While this provides fast and memory-efficient approximate cardinality calculations, it introduces a small margin of error, which is a known behavior described in Redis's documentation.
How Redis HyperLogLog (HLL) Works
HyperLogLog is a probabilistic data structure used to estimate the number of unique elements in a dataset. Unlike traditional methods that store each element explicitly (which could require large amounts of memory), HLL works by hashing elements and using a clever algorithm to approximate the count of unique items. The benefit is that HLL can store and process large datasets with a memory footprint of only 12 KB, regardless of the number of elements.
For reach calculations on our platform, Redis HLL is used to count the number of unique users that have seen an ad. This allows us to quickly and efficiently calculate reach without the need for expensive, memory-intensive processes.
Minor Discrepancy and Its Impact on Reporting
Because HLL is an approximation algorithm, there can be a slight margin of error in its calculations, typically around 0.81% in Redis. This means that while HLL provides a close estimate of unique users, it may not always be perfectly accurate.
Example: Impression Capping and Reach Discrepancy
Consider a scenario where a campaign has strict impression capping, such as 1 impression per user. In this case, you might expect the reach to be exactly equal to the number of impressions (since each user should see only one ad). However, due to the nature of HLL’s probabilistic counting, there could be a slight discrepancy between the reported reach and impressions.
For example:
-
Expected reach = impressions: 1,000 unique users are shown 1 impression each.
-
Reported reach using HLL: Could be slightly less (e.g., 995) or slightly more (e.g., 1,005) than the exact number of impressions due to the algorithm’s margin of error.
Why This Small Discrepancy Exists
This discrepancy is inherent in how the HyperLogLog algorithm estimates counts. The algorithm trades off perfect accuracy for speed and efficiency, which is why the memory footprint remains small even for large datasets. The small error is generally negligible but becomes noticeable in edge cases, such as when the number of impressions per user is strictly controlled.
Key Takeaways
-
Efficient Reach Estimation: Our DSP platform leverages Redis HLL to efficiently calculate unique reach with minimal memory usage.
-
Small Margin of Error: Redis HLL introduces a small error (~0.81%), meaning that reach estimates may not always be exact.
-
Impression Capping Consideration: In scenarios with strict impression capping (e.g., 1 impression per user), small discrepancies between reported reach and impressions may occur due to HLL’s approximate nature.
While this method offers significant performance and cost benefits, it’s important to be aware of the potential for minor discrepancies in unique reach estimates. This is a natural outcome of using Redis HLL and is within the expected error range.
For cases where absolute accuracy is critical, alternative counting methods may be considered, but they typically involve higher memory and processing costs.