| **Shop Name** | **Total footfall users** |
| Shop 1 | 6,607 |
| Shop 2 | 1,650 |
| Shop 3 | 579 |
| Shop 4 | 97,053 |
| Shop 5 | 4,399 |
| Shop 6 | 200 |
| Shop 7 | 386 |
| Shop 8 | 231 |
| **Shop Name** | **Total Footfall Users** | **Footfall Rate %\*** |
| All Shops | 1,354,556 | 1.4% |
| **Traffic Source**
| **Footfall Users**
| **Footfall Rate %**
|
|---|---|---|
| Region 1 | 44,555 | 1.21% |
| Region 2 | 21,334 | 0.91% |
| Region 3 | 10,341 | 0.56% |
| Region 4 | 9,443 | 0.10% |
| **Traffic Source**
| **The Most Visited Shop**
|
|---|---|
| Region 1 | Shop 5 |
| Region 2 | Shop 1 |
| Region 3 | Shop 2 |
| Region 4 | Shop 4 |
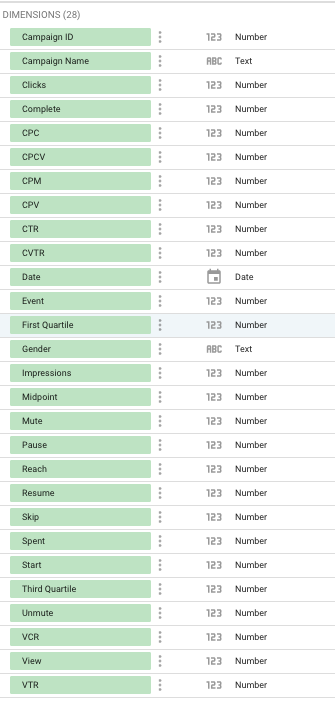
Please use the fields as **Dimensions** to avoid data discrepancies
[](https://manual.eskimi.com/uploads/images/gallery/2023-10/K96uL3mn1GBNcZU3-image-1697437345409.png) # Filtered Impressions The Filtered Impressions widget is a helpful tool that shows the percentage of impressions that were filtered out from your campaigns. This can happen due to multiple reasons, such as specific targeting settings, creatives, budget & pacing limitations, and more. The percentage displayed indicates the number of impressions that didn't meet the specified criteria and were therefore excluded from the campaign. [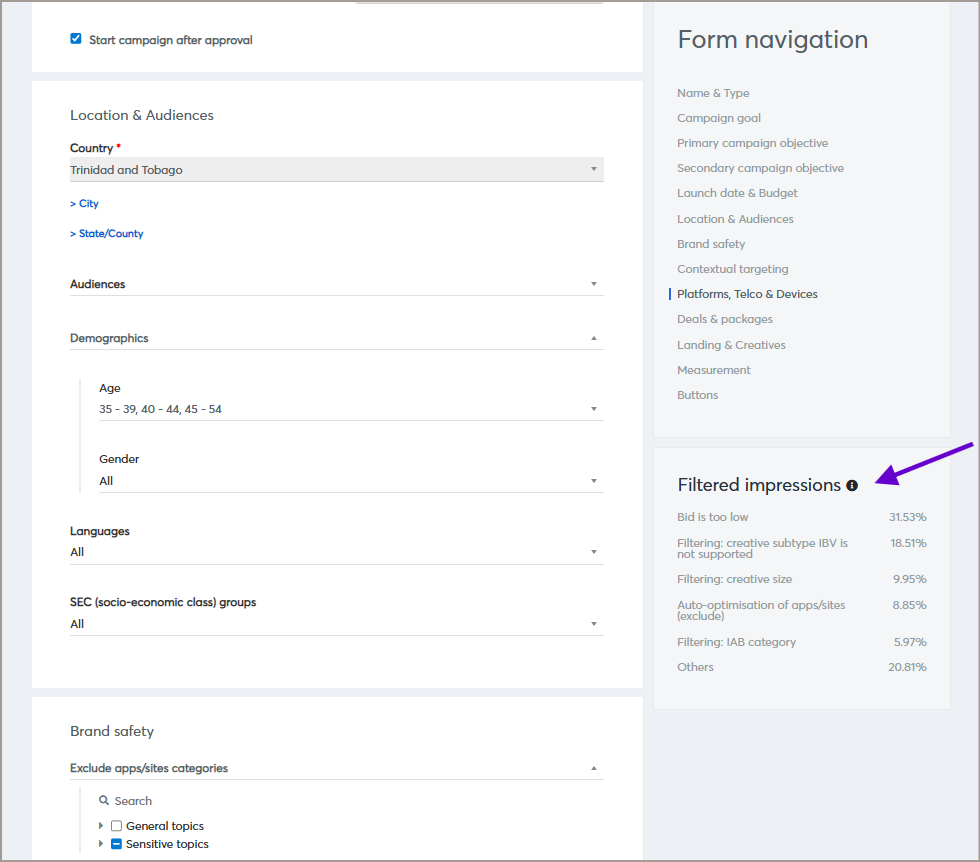](https://manual.eskimi.com/uploads/images/gallery/2025-09/yY0cfHoyd19QIXZE-image.png) Impressions can be filtered for the following reasons. --- ##### **Pre-bid** The number of impressions not bought due to a pre-bid issue: - **Invalid traffic.** Number of queries that were filtered because they are considered invalid traffic, e.g., fake clickers. - **Unauthorized seller (Ads.txt).** Number of queries that were filtered because they are from Unauthorized Sellers. - **Rewarded ads are not supported.** Number of queries that were filtered because the requests contain rewarded ads that are not supported. --- ##### **Targeting** The number of impressions that were filtered due to targeting settings on your campaigns.| **Targeting Setting** | **Description** |
| Ad placement position | Impressions that did not match ad positions selected in the campaign, e.g. above the fold. |
| SEC & LSM | Impressions that did not match the SEC & LSM targeting selected in the campaign. Read more [here](https://manual.eskimi.com/books/targeting-dJM/page/socio-economic-class-sec-living-standards-measure-lsm-targeting). |
| Audience | Impressions that did not match the audience targeting options used in the campaign, e.g., DMP audience or retargeting audience. |
| Device | Impressions that did not match the device targeting used in the campaign. It could be related to device type, OS, brand or model. |
| Browser | Impressions that did not match the targeted web browser in the campaign. |
| Environment | Impressions that did not match the environment (apps or sites) targeting options used in the campaign. |
| Operator/ISP | Impressions that were excluded due to operator/ISP targeting options used in the campaign. |
| Location | Impressions that did not match the location targeting of the campaign, e.g. country, cities, states, or zip codes. |
| Language | Impressions that were excluded due to language targeting options selected in the campaign. |
| Brand Safety | Impressions that did not match one or more brand safety settings set up in the campaign. |
| IP addresses/ranges | Impressions that did not match the targeted IP address or ranges of the campaign. |
| Categories | Impressions that did not match the app/site categories selection of the campaign. |