# Telcodash
# Telco Taxonomy Usage Guidelines
Telco taxonomy provides information about the amount of data Eskimi DMP has under different segments. It indicates the amount that can be exported based on client needs.
---
### **Market Challenges**
Telco taxonomy is a great product for clients who are looking for a solution where they will be able to target niche Eskimi audiences on 3rd party platforms.
**Reach Custom User Segments in any digital platform. **Telcos want to have the ability to target custom segments on any digital platform. However, not all of them offer the comprehensive targeting that telecoms need.
**See full user consumption. **Telecoms need to build segments and understand the full consumption across all telecoms under one Device ID.
**Specialised telecom data. **For telecoms, there’s a need for actionable data to optimise the customer experience. Telecoms want to use segments that are based on real user consumption of telecommunication services.
---
### **Use Cases**
**Current customers.** Target current customers by their consumption on all media platforms (Eskimi, Facebook, etc.).
**Retain lost consumers. **Target lost customers who migrated to other telecoms.
**Competition. **Target users who are using our competitors' products and/or are about to churn.
**ISP. **Upsell your ISP services for mobile consumers.
**Improve SMS/USSD communication.** Improve retention and ARPU growth-focused communication.
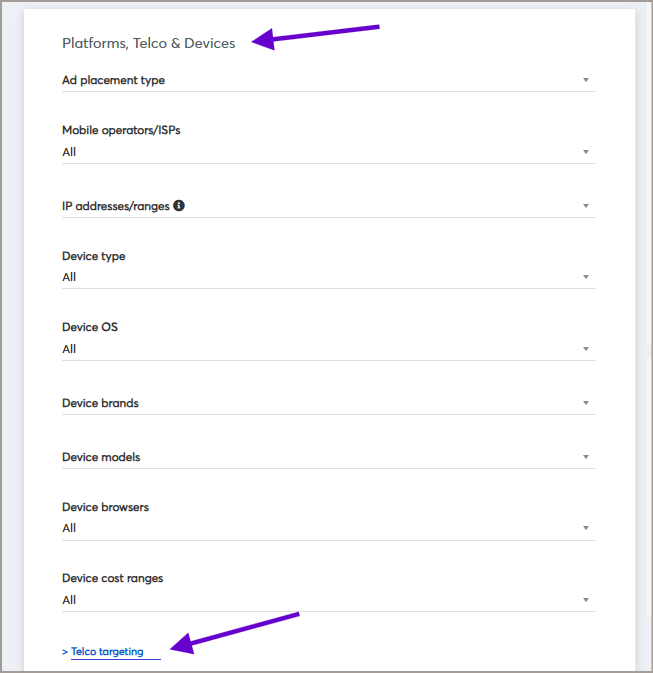
# Advance Telco Targeting
# SIM amount targeting
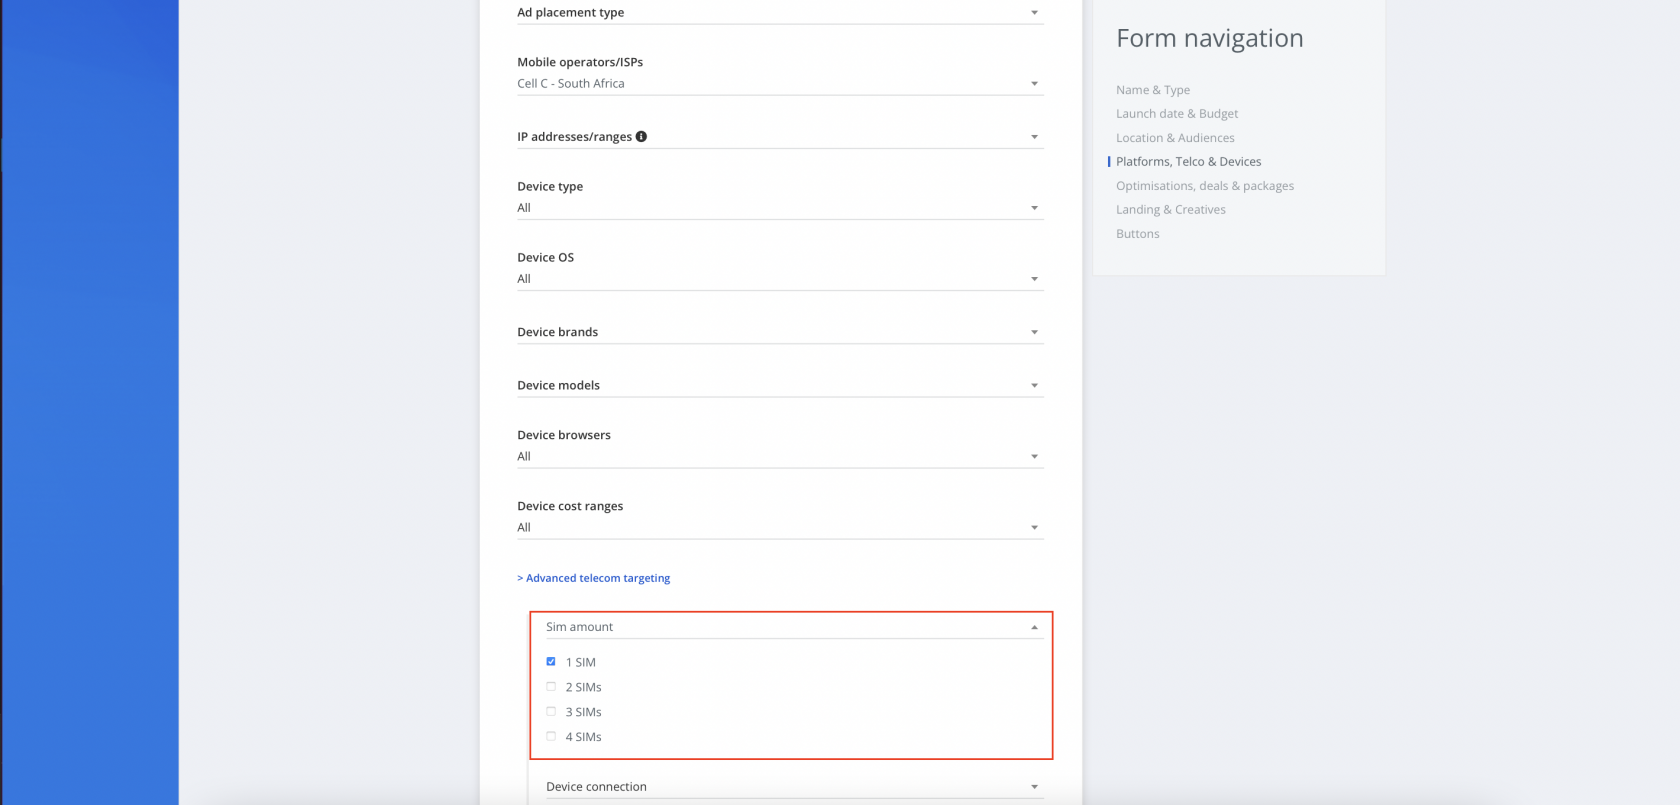
#### **What is SIM amount targeting?**
SIM amount targeting, which can be found under *Advanced telecom targeting,* allows brands to target users who were browsing online with 1, 2, 3, or 4 SIM cards for the last 30 days.
[](https://manual.eskimi.com/uploads/images/gallery/2025-09/EVbvqLE3jkwONqYi-image.png)
---
#### **What is the logic?**
This targeting is based on Eskimi DMP (Data Management Platform). This is the place where online data is crunched and aggregated. The system checks if the user was only connected to a certain number of operators. If the user was seen using only 1 telecom, then the user will be considered as 1 SIM user.
---
#### **What are the use cases?**
**New customer acquisition** - telecoms can target their competition's customers.
**Personalized offering** - telecoms will be able to run different communication lines for their loyal and multi-SIM customers.
[](https://manual.eskimi.com/uploads/images/gallery/2021-11/wJsoHLxSEGs67gG3-screenshot-2021-11-24-at-17-41-46.png)
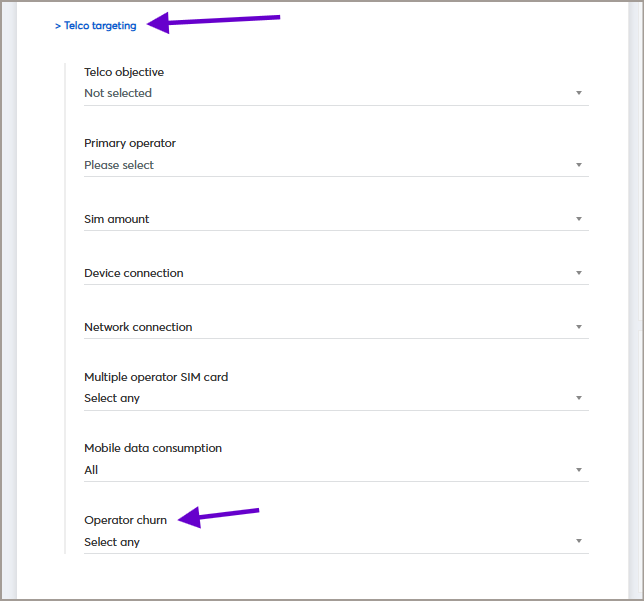
# Operator churn targeting
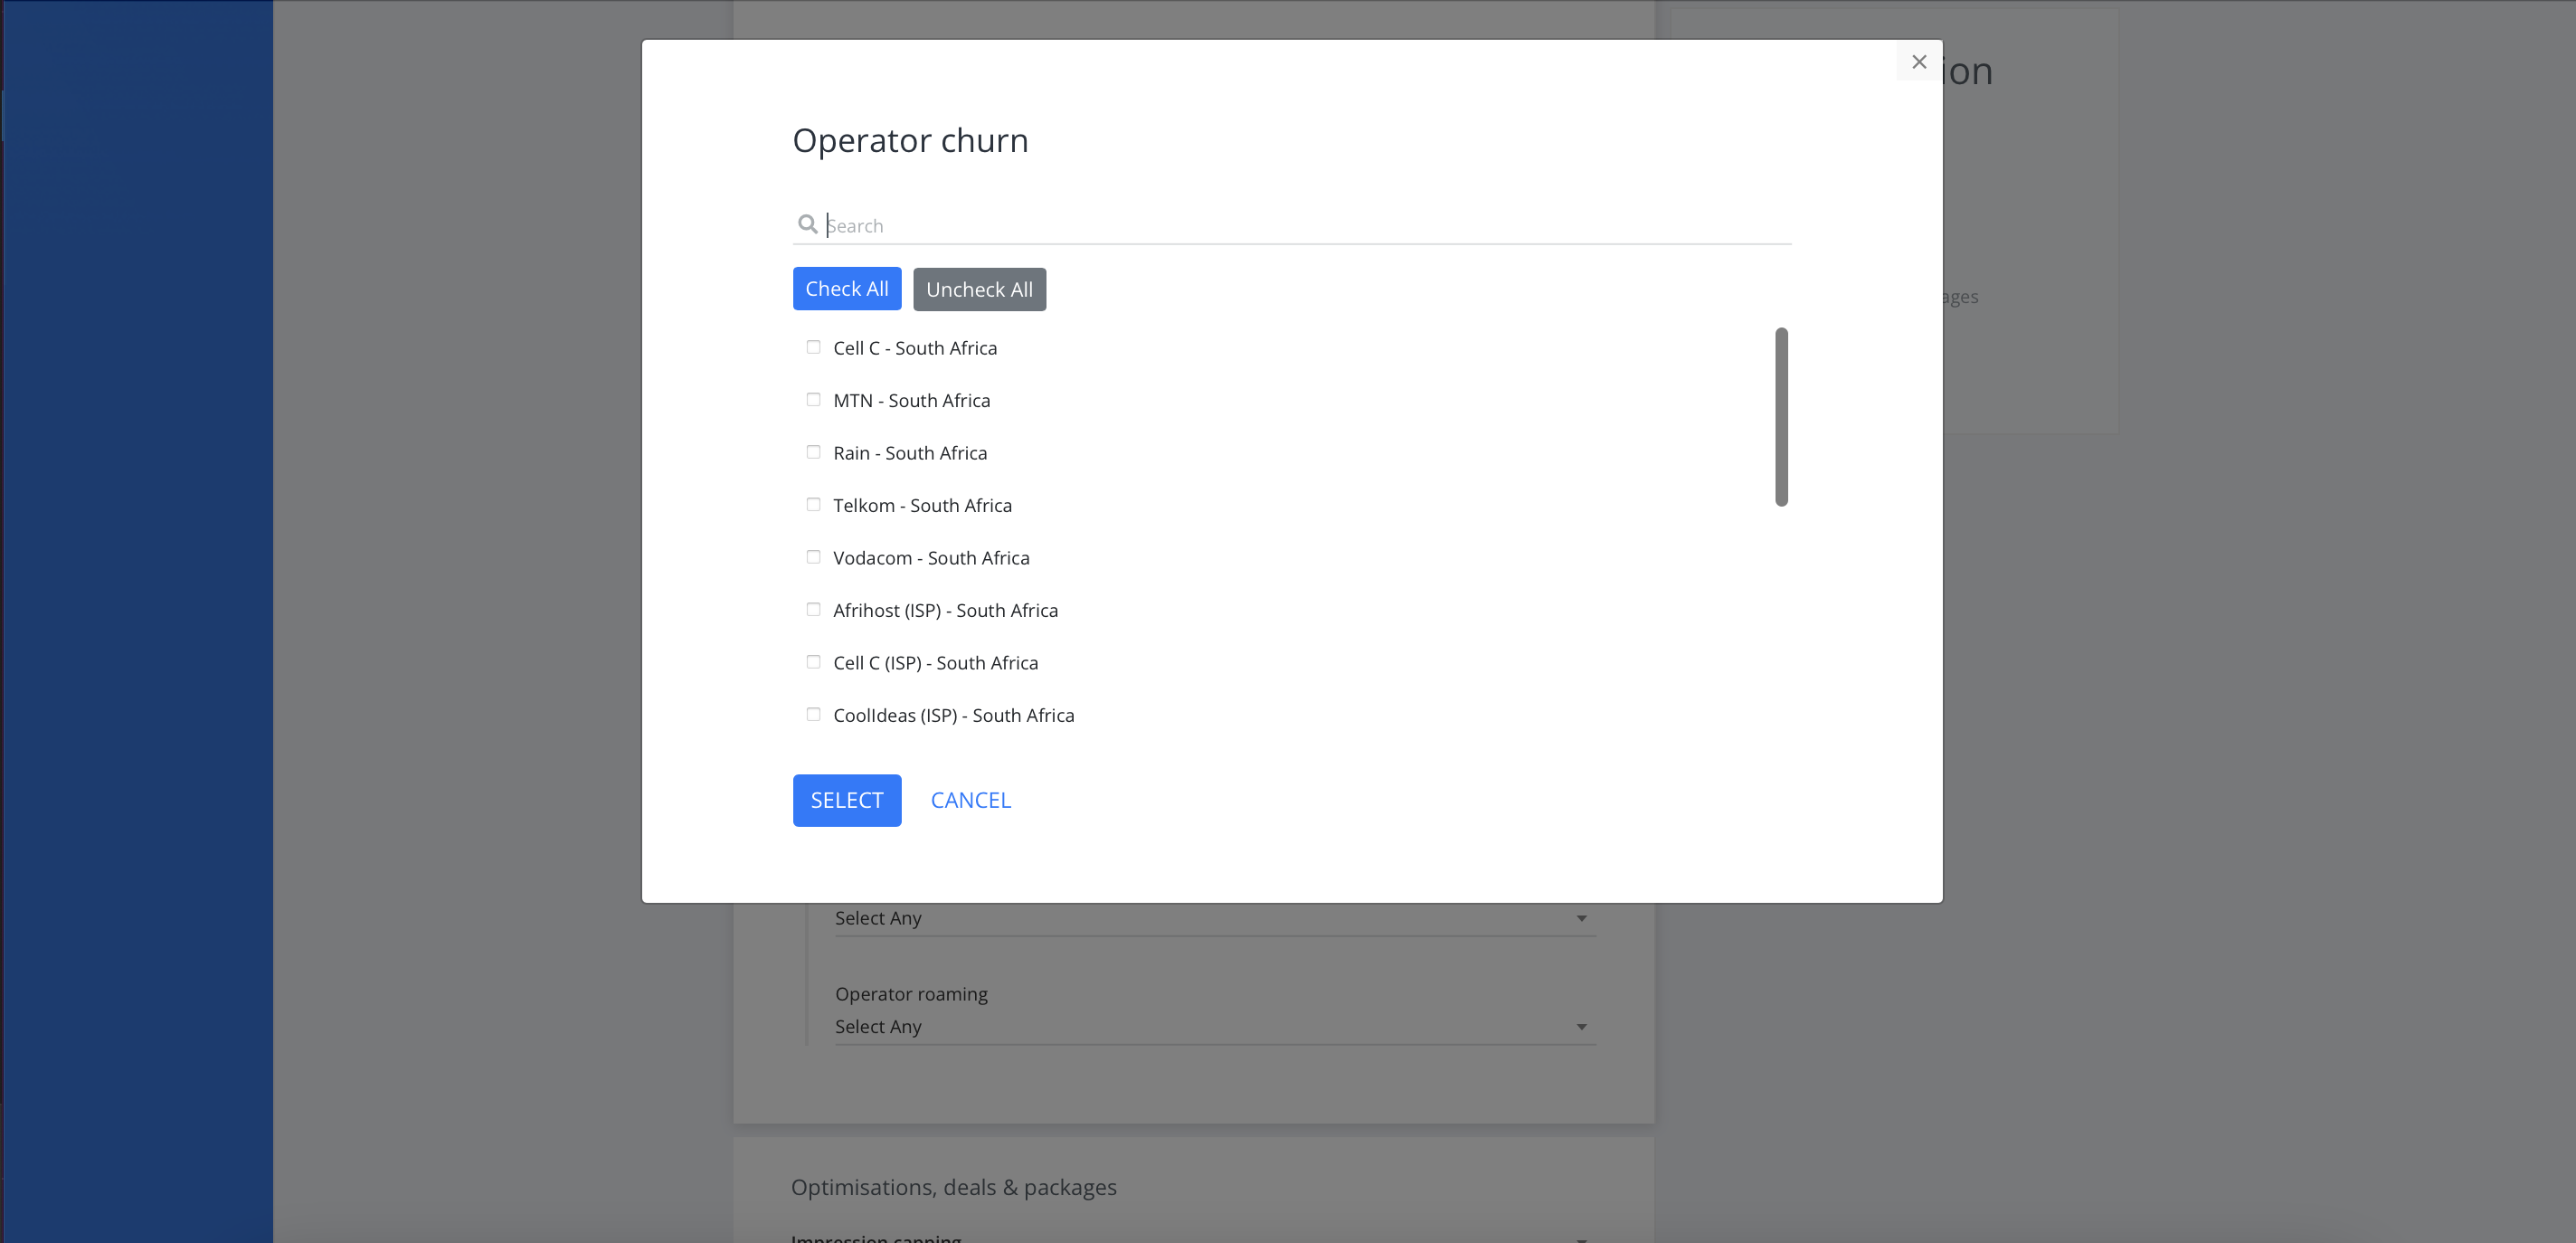
#### **What is operator churn targeting?**
Operator churn targeting, which can be found under *Advanced telecom targeting,* allows brands to target lost customers and reach lost customers of the competition.
[](https://manual.eskimi.com/uploads/images/gallery/2025-09/Br6MfbD8hbmSxW7c-image.png)
[](https://manual.eskimi.com/uploads/images/gallery/2025-09/zOBjwZtDwSX96S83-image.png)
---
#### **What is the logic?**
Churn is calculated when the operator was last seen used 14 days or more ago within a maximum of 60-day period. Additionally, if the user starts using the operator again, the customer will be excluded from the audience.
---
#### **What are the use cases?**
**Win-back** - telecoms can sustain their revenue by targeting lost customers.
[](https://manual.eskimi.com/uploads/images/gallery/2021-11/YPRrfXBxOYTv624O-screenshot-2021-11-24-at-17-50-12.png)