Overview page
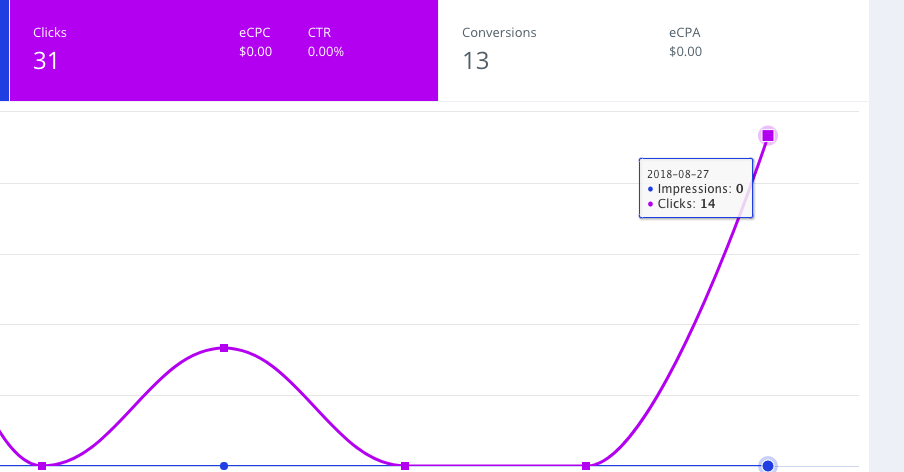
"Eskimi DSP" dashboard is an at-a-glance view of all your campaigns and their main KPI's in the selected period of time. It provides the aggregated data from all campaigns that were running at the selected period of time. You can see you're spent, impressions, clicks, and conversions in the numeric form and in the graphic below.

How to use it ?
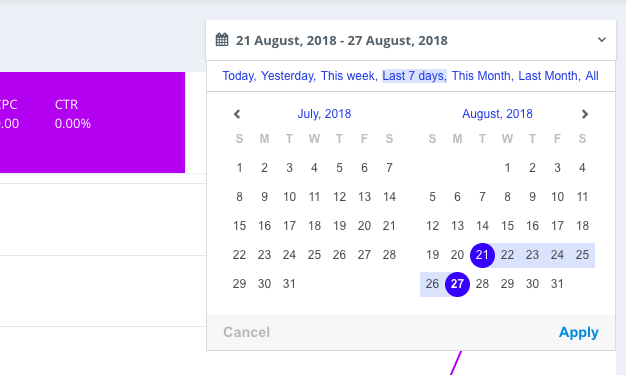
Select the time period in the drop-down menu in the upright corner of your window and click apply.
You can see exact KPI's in the graphic just by putting your mouse on the bubble. And as well you can see more detailed graphs when scrolling below.