Footfall
You may think that driving people to your website is the only use for online advertising – but did you know that if you have a physical shop, Eskimi Ads can be key in bringing more customers through your business’ front door?
Footfall is a marketing term used by retailers for describing the number of customers that enter their stores.
Footfall attribution is a method used to correlate digital marketing campaign impressions to actual store visits.
The primary goal is to Initiate offline user activity to your physical store/location.
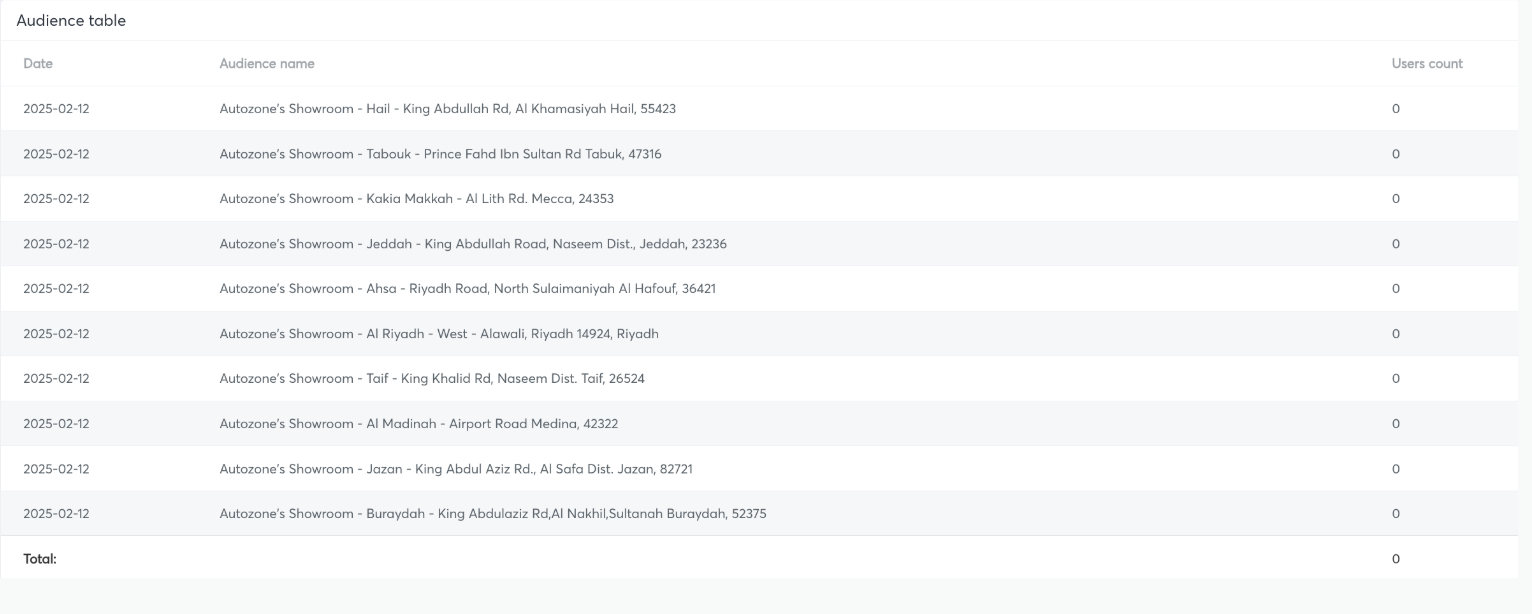
Footfall table example in Eskimi DSP report(Please note that the audience table is called Audiences and the footfall table is called Audience table, below you can see an example of a footfall table)
Technology
Target users in different places. You can choose a wide range of targeting opportunities:
-
Country-wise - you can target the whole country. However, this may reduce the likelihood for people to visit your store if it in another part of the country.
-
Regional wise - this targeting would allow you to still reach a rather big amount of users, but it should bring better accuracy than country-wise targeting.
-
Radius targeting - To maximize the footfall results target users who are frequently next to your physical shop. Radius can differ depending on your goal, country, amount of shops, and other factors.
-
Other targeting opportunities - to reach good results the essential thing is to target app traffic. So you can use previous geofence audiences, impressions audiences from previous campaigns, interest audience and etc. Just don’t forget to enable only apps.
Footfall technology is based on various data segments. From which the primary is device IDs which is analyzed and compared from the users who have seen the ad and appeared in your physical store/location. Also, the solution takes into consideration real-time GPS location data. Meaning, that users are captured and analyzed in real-time.
Limitations - the majority of users will be reached on apps
Results
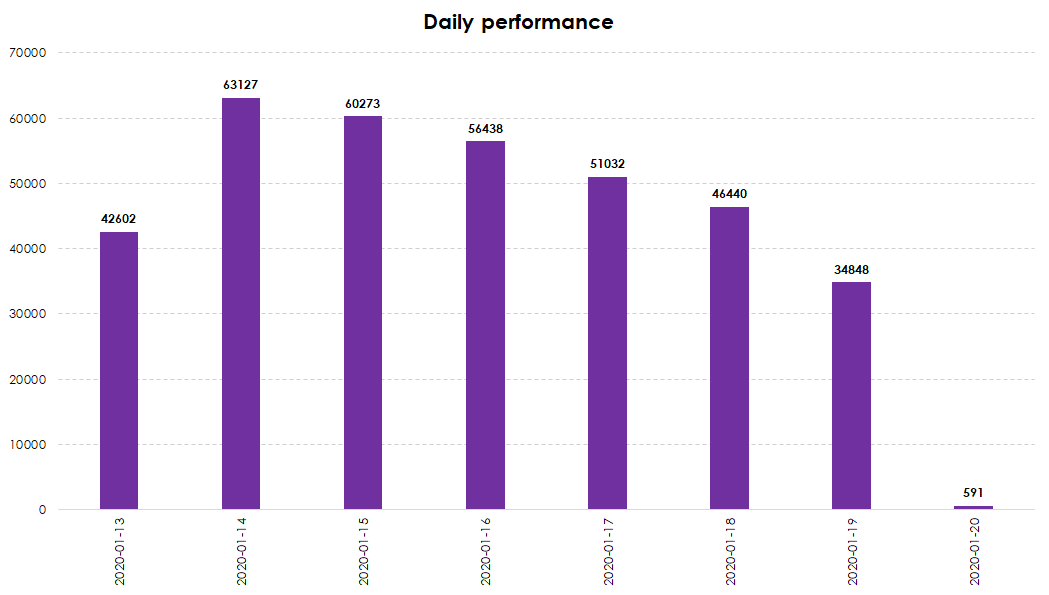
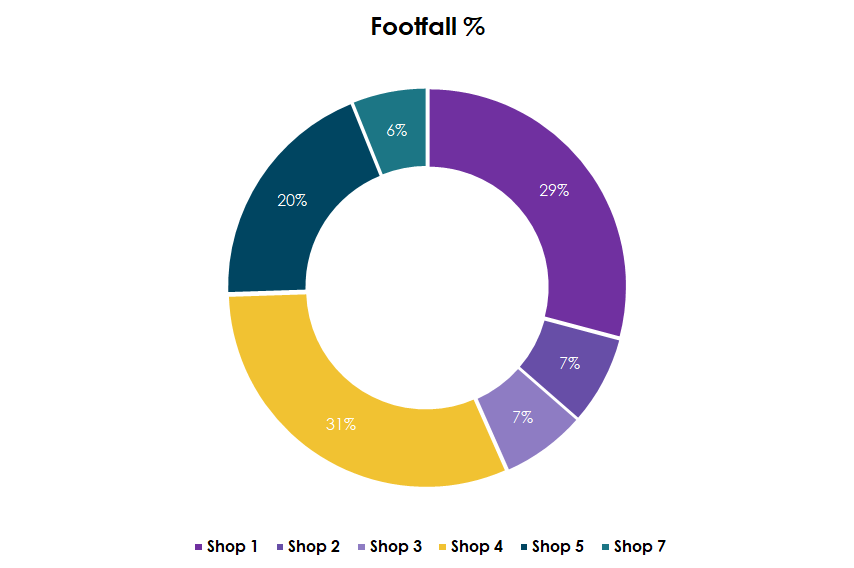
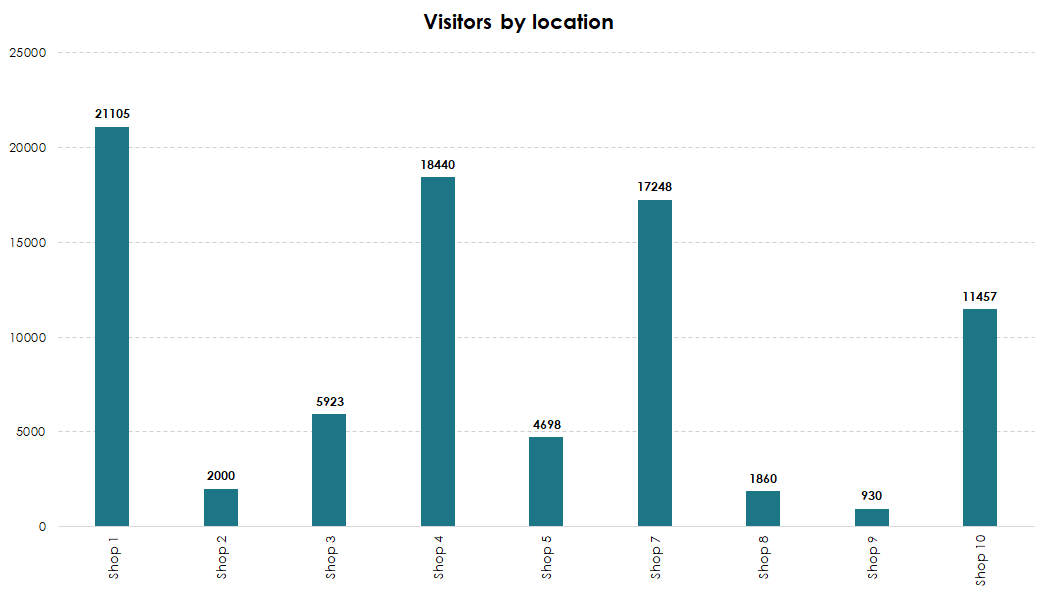
Eskimi DSP not only enables footfall measurement, but also helps your brand better understand the type of audience reached. It provides valuable audience insights based on the collected data and allows you to dive deeper into the results for a more comprehensive understanding of footfall performance.
|
Shop Name |
Total footfall users |
|
Shop 1 |
6,607 |
|
Shop 2 |
1,650 |
|
Shop 3 |
579 |
|
Shop 4 |
97,053 |
|
Shop 5 |
4,399 |
|
Shop 6 |
200 |
|
Shop 7 |
386 |
|
Shop 8 |
231 |
|
Shop Name |
Total Footfall Users |
Footfall Rate %* |
|
All Shops |
1,354,556 |
1.4% |
*Footfall rate is counted: users visited the shop / Total Reach
|
Traffic Source |
Footfall Users |
Footfall Rate % |
|---|---|---|
|
Region 1 |
44,555 |
1.21% |
|
Region 2 |
21,334 |
0.91% |
|
Region 3 |
10,341 |
0.56% |
|
Region 4 |
9,443 |
0.10% |
|
Traffic Source |
The Most Visited Shop |
|---|---|
|
Region 1 |
Shop 5 |
|
Region 2 |
Shop 1 |
|
Region 3 |
Shop 2 |
|
Region 4 |
Shop 4 |
These reports are provided as examples. Their level of detail depends on the campaign setup and segmentation. They are not automatically generated in the dashboard, but are prepared by our internal reporting team.
Media Planning
Budget: We strongly recommend starting from 10 000$. As with this budget, the client would receive the full package of footfall possibilities.
Audience Collection: Plan at least 2-3 days before the campaign launch for the audience collection.
Goal: Clearly understand the client’s objectives, what they aim to measure, and how they define success. Additionally, confirm whether they will track any metrics on their end.
Reporting: Inform the client that it will take up to 3 working days to prepare the report.
- Displays cross-matches between the targeted audience and the footfall audience.
- Displays the sum, not an overlap.
- The user can be cross-matched at any point in time after the ad is seen.
- Footfall reach shows users in sum, not unique users.
- The user will be calculated continuously every time he/she visits the location after seeing the ad.