Telco Dashboard in details
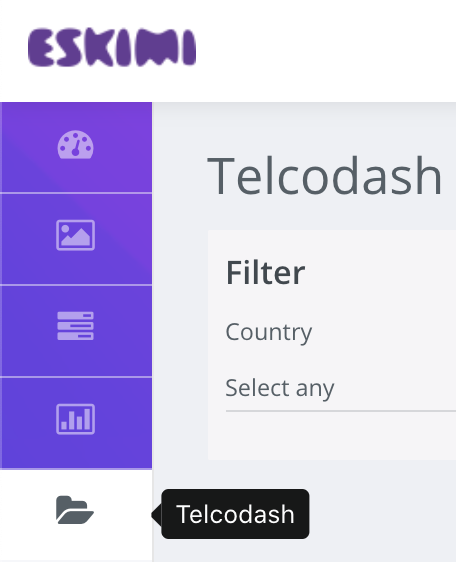
You will find Telco Dashboard on your left side menu:
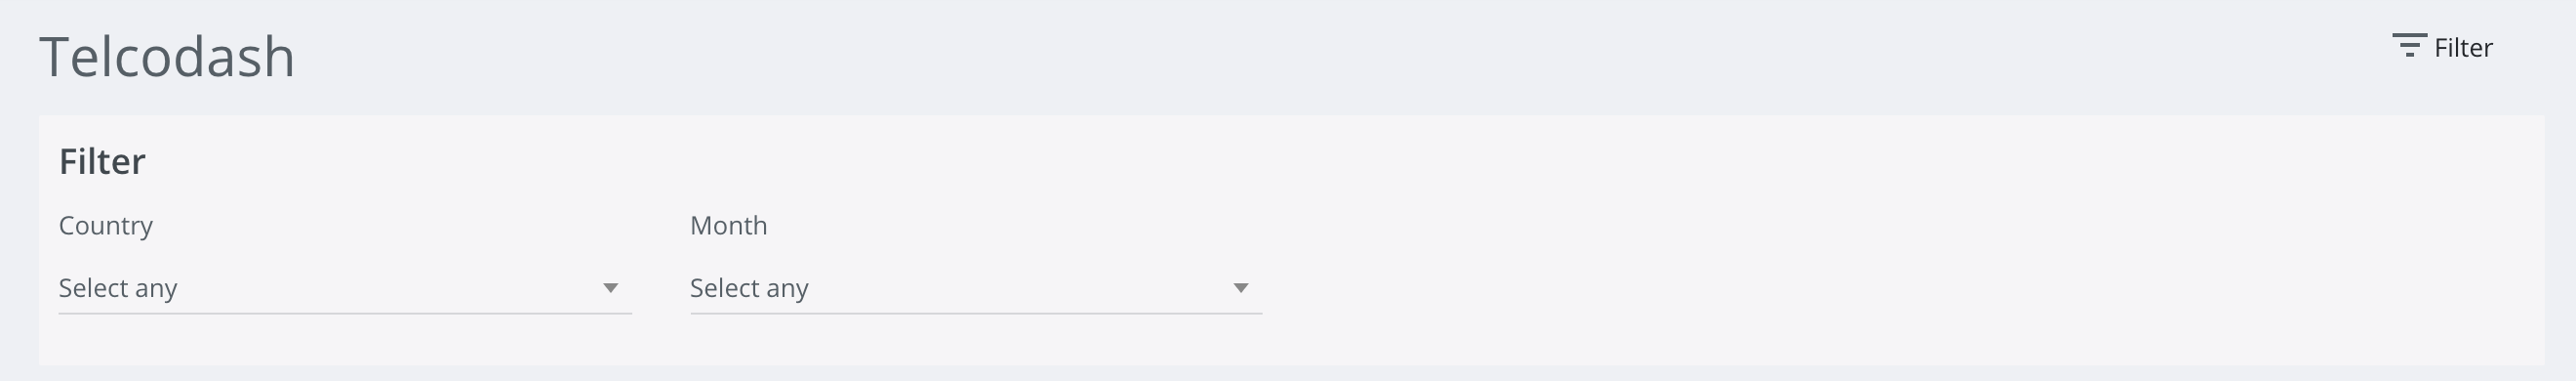
Then you will be asked to choose the country and month that you want to filter. Please pay attention that data is available only for the previous, not the current month:
Once the data is loaded, there will be 3 sections where you can review relevant information: (1) Market overview, (2) Economics, (3) Mobile devices.

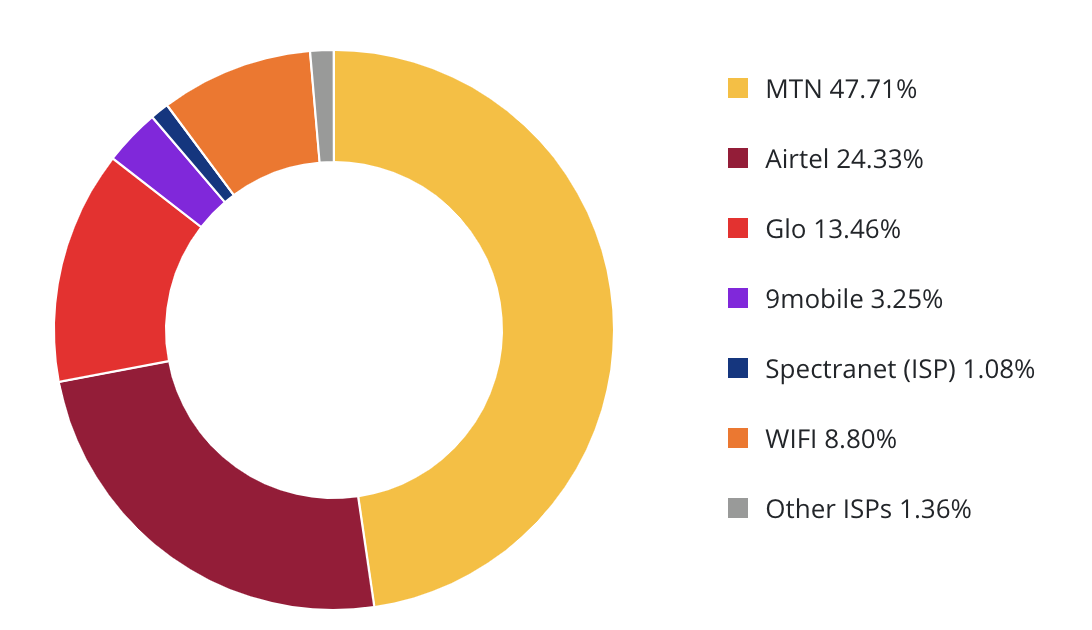
Data market shares (all)
This widget shows how the internet data market is divided by Mobile Network Operators (MNO) and Internet Service Providers (ISP). The data source: impressions.
|
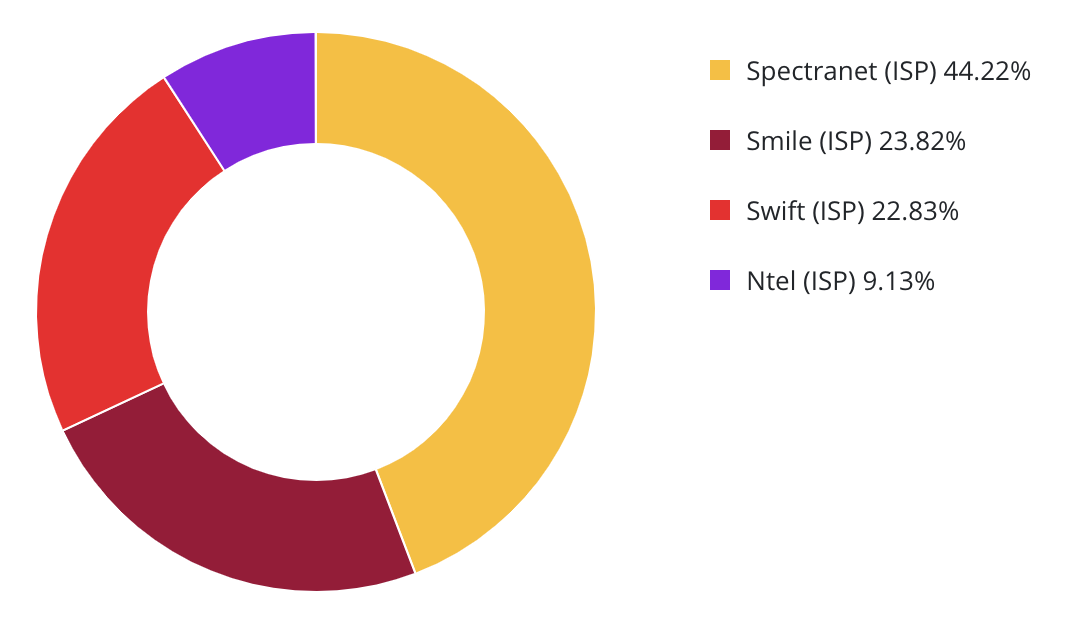
ISP data market share
This widget shows how the market is divided by the Internet Service Providers (ISP). The data source: impressions.
|
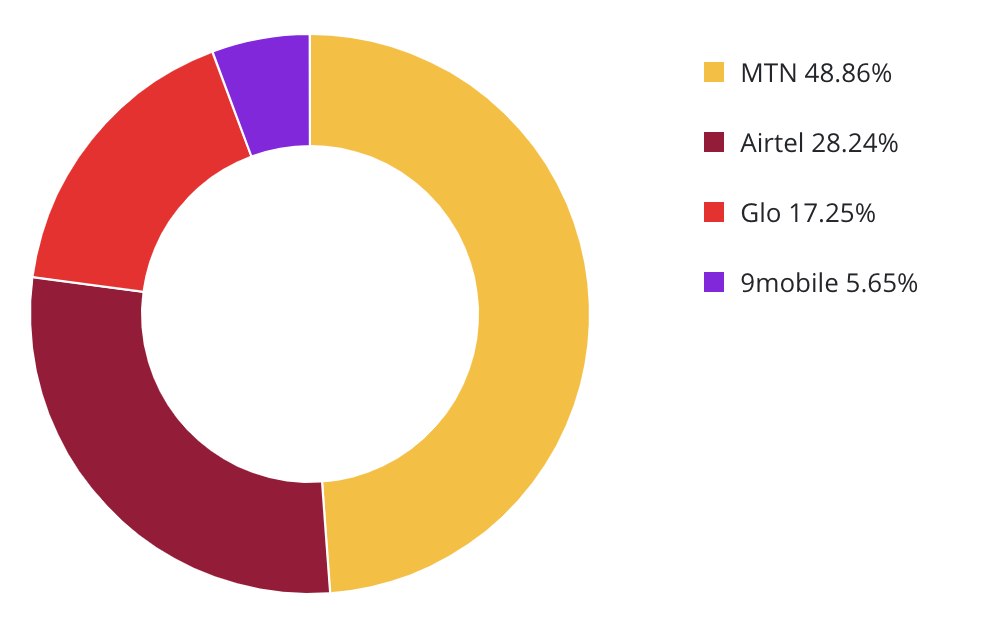
Mobile data market share
This widget shows how the mobile data market is divided by Mobile Network Operators (MNO). The data source: impressions.
|
Mobile network unique user distribution
This widget shows market split per Mobile Network Operator (MNO) in unique users. The data source: unique users (DMP IDs).
|
Mobile data vs. WIFI/DSL/Fiber by consumption
This widget shows the market split between mobile and other other (WiFi, DSL, Fiber) internet data usage. The data source: impressions.
|
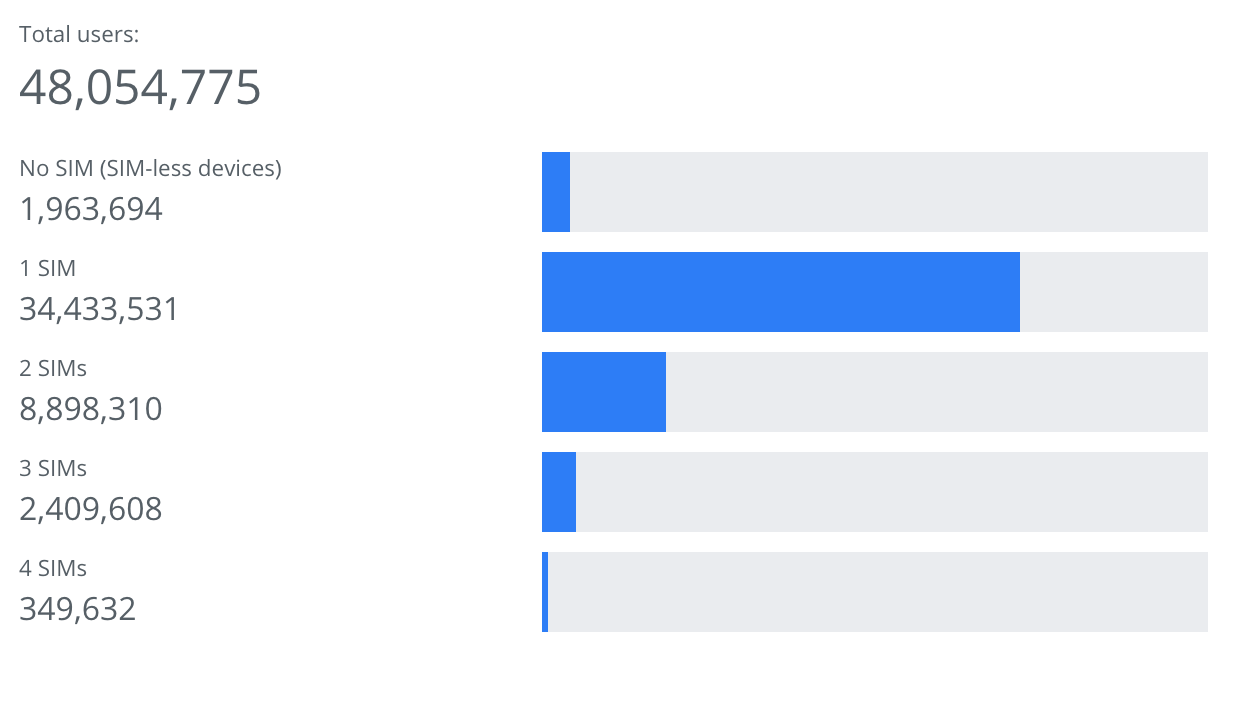
Users by SIM count
This widget shows how many SIM cards this unique user (DMP ID) used for mobile data usage ever. Here no SIM (SIM-less devices) number show devices with the internet access without SIM card usage (tablets, laptops, desktop PCs, iPads and others).
|
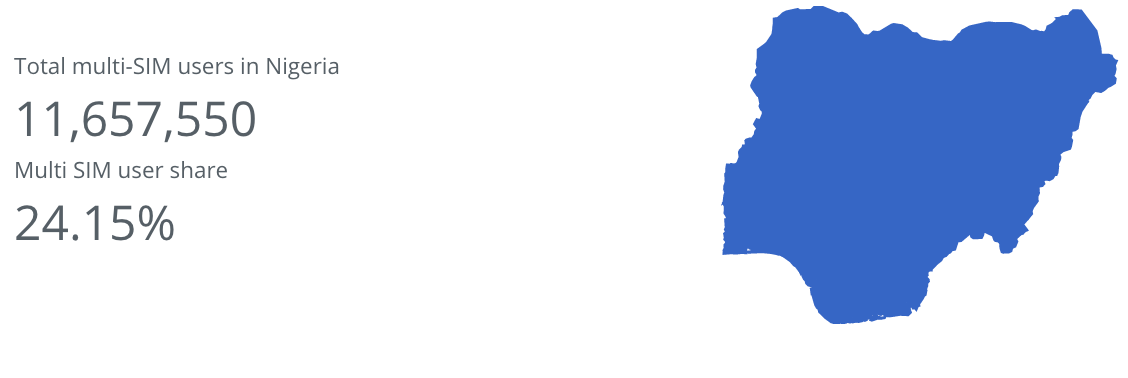
Multi-SIM users
This widget shows how many users have been using more than 2 SIM cards for the mobile |
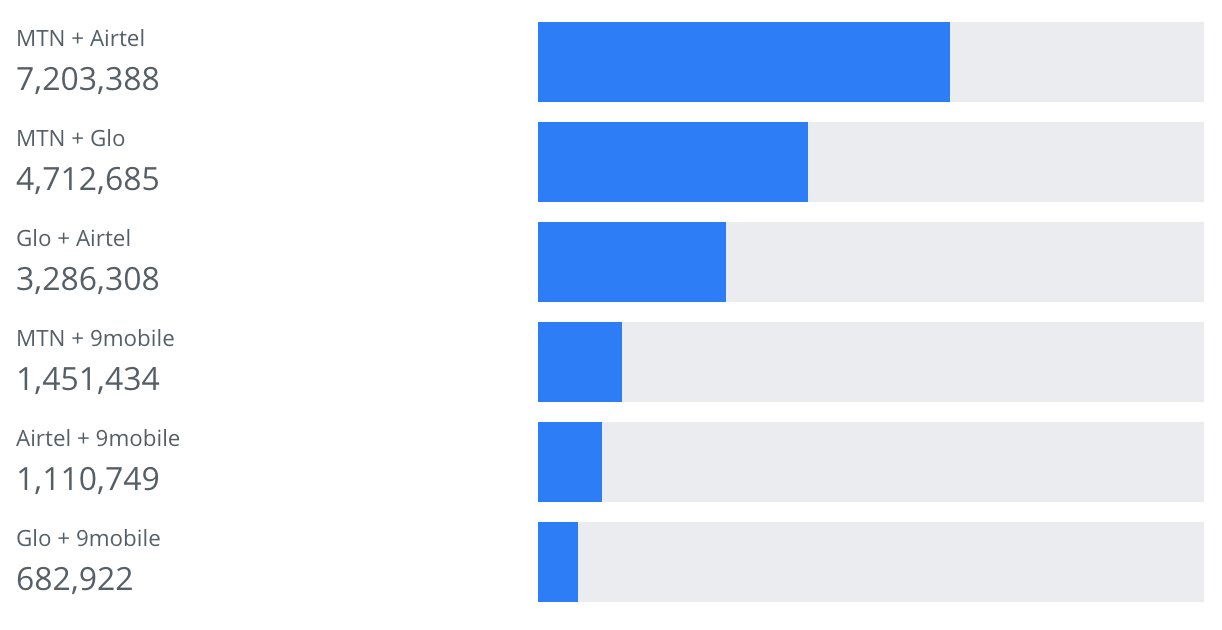
Top main pairs
This widget shows the main SIM pairs used in the market for mobile data usage. The sequence in the naming doesn’t mean that one Mobile Network Operator (MNO) is the first and another second. There is no relation between the naming and
|
Migrations and TOP migrations
This widget shows the latest migrations in the mobile data (internet) usage pattern. TO shows the current SIM card used for mobile data. FROM shows the latest previous SIM card used for mobile data access. |
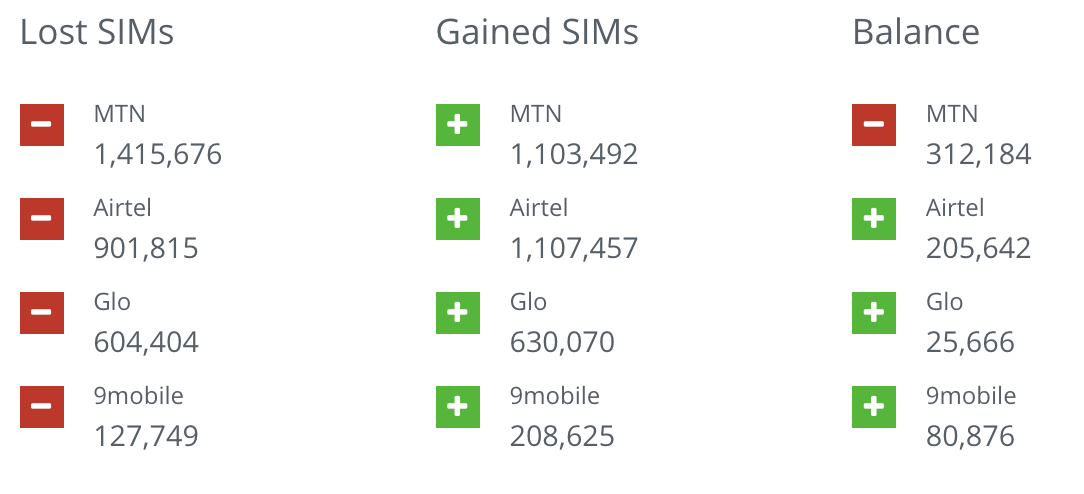
Lost and gained
In this widget Lost means how many users stopped to use Mobile Network Operator (MNO) SIM card for mobile data in the past 14 days. Gained shows how many users started to use new operator’s SIM card for mobile data access. This data is NOT about mobile number portability (MNP) when the real phone number is migrated from one network to another.
|
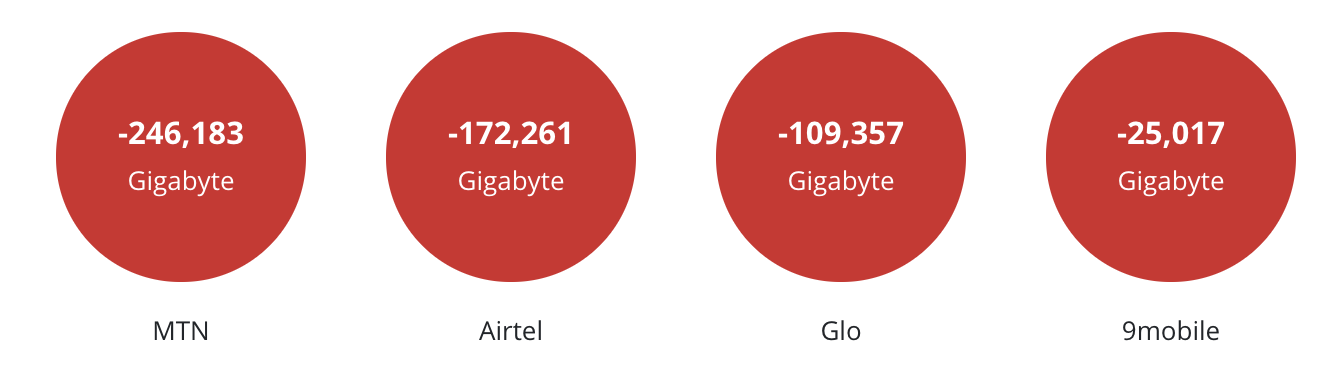
Data loss due to secondarySIM position
This widget shows the accumulated amount of mobile data lost per each Mobile Network Operator (MNO) due to their SIM used as the secondary SIM for the mobile internet access.
|
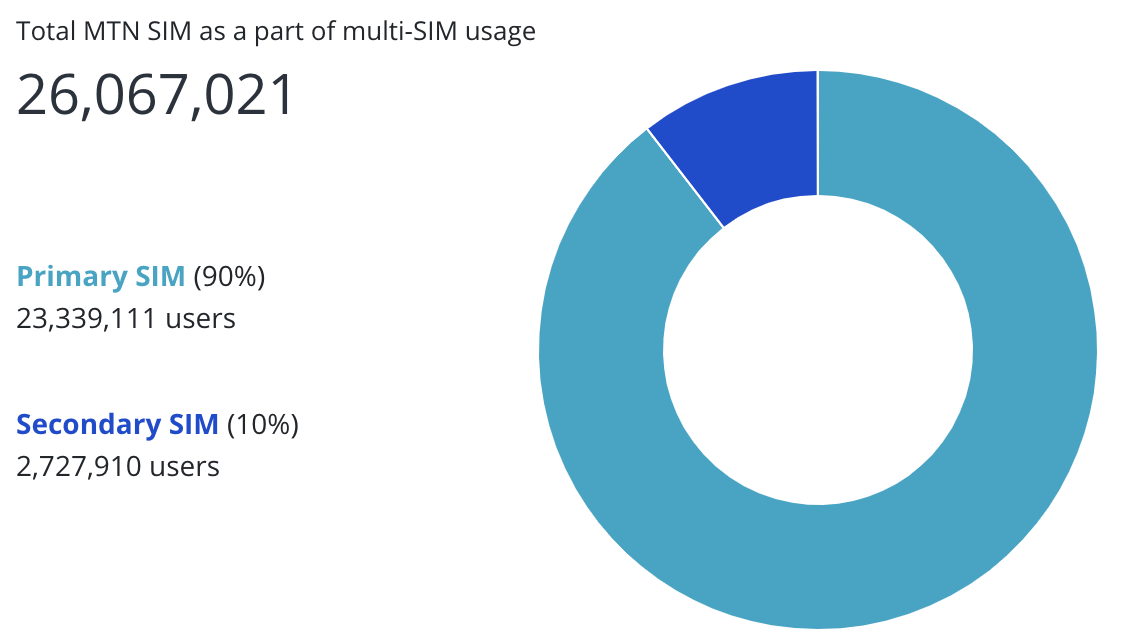
Secondary SIM position
This widget shows the percentage of Mobile Network Operator (MNO) SIM cards used as the primary and secondary SIMs for the internet access. The secondary SIM is indicated as seen less often using the mobile internet in the comparison with the primary SIM.
|
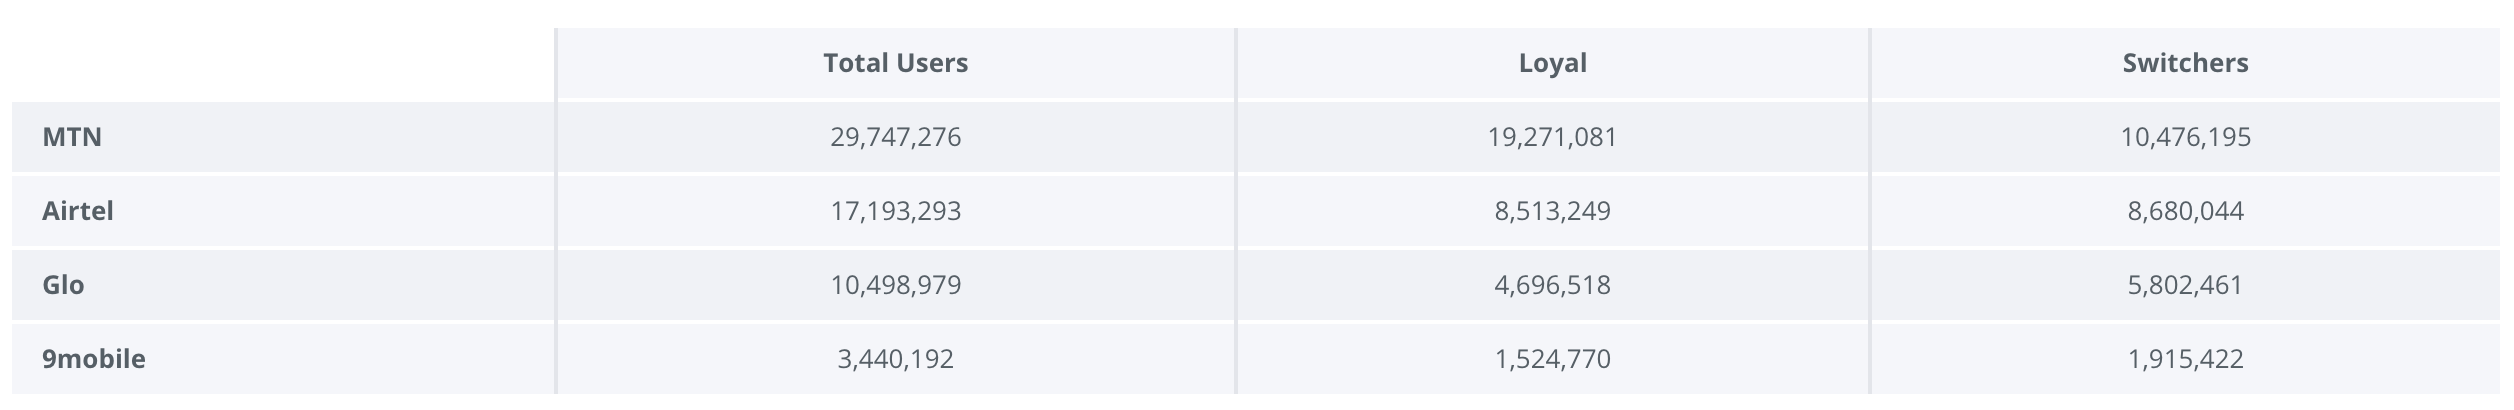
User loyalty
In this widget Loyal users mean those who all the time used only one Mobile Network Operator (MNO). Meanwhile Switchers changed 1 or more operators during their life time.
|
Top device brands in the country
This widget shows the market split by the most popular mobile device brands. The data source: unique users (DMP IDs). |
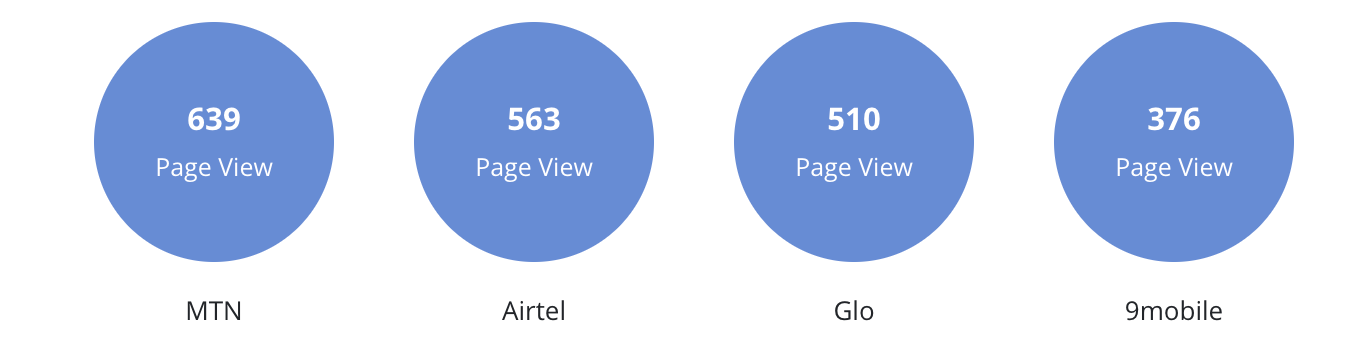
Avg. page views by operators and comparison
This widget shows an average number of page views generated by the average Mobile Network Operator (MNO) while using the internet.
|
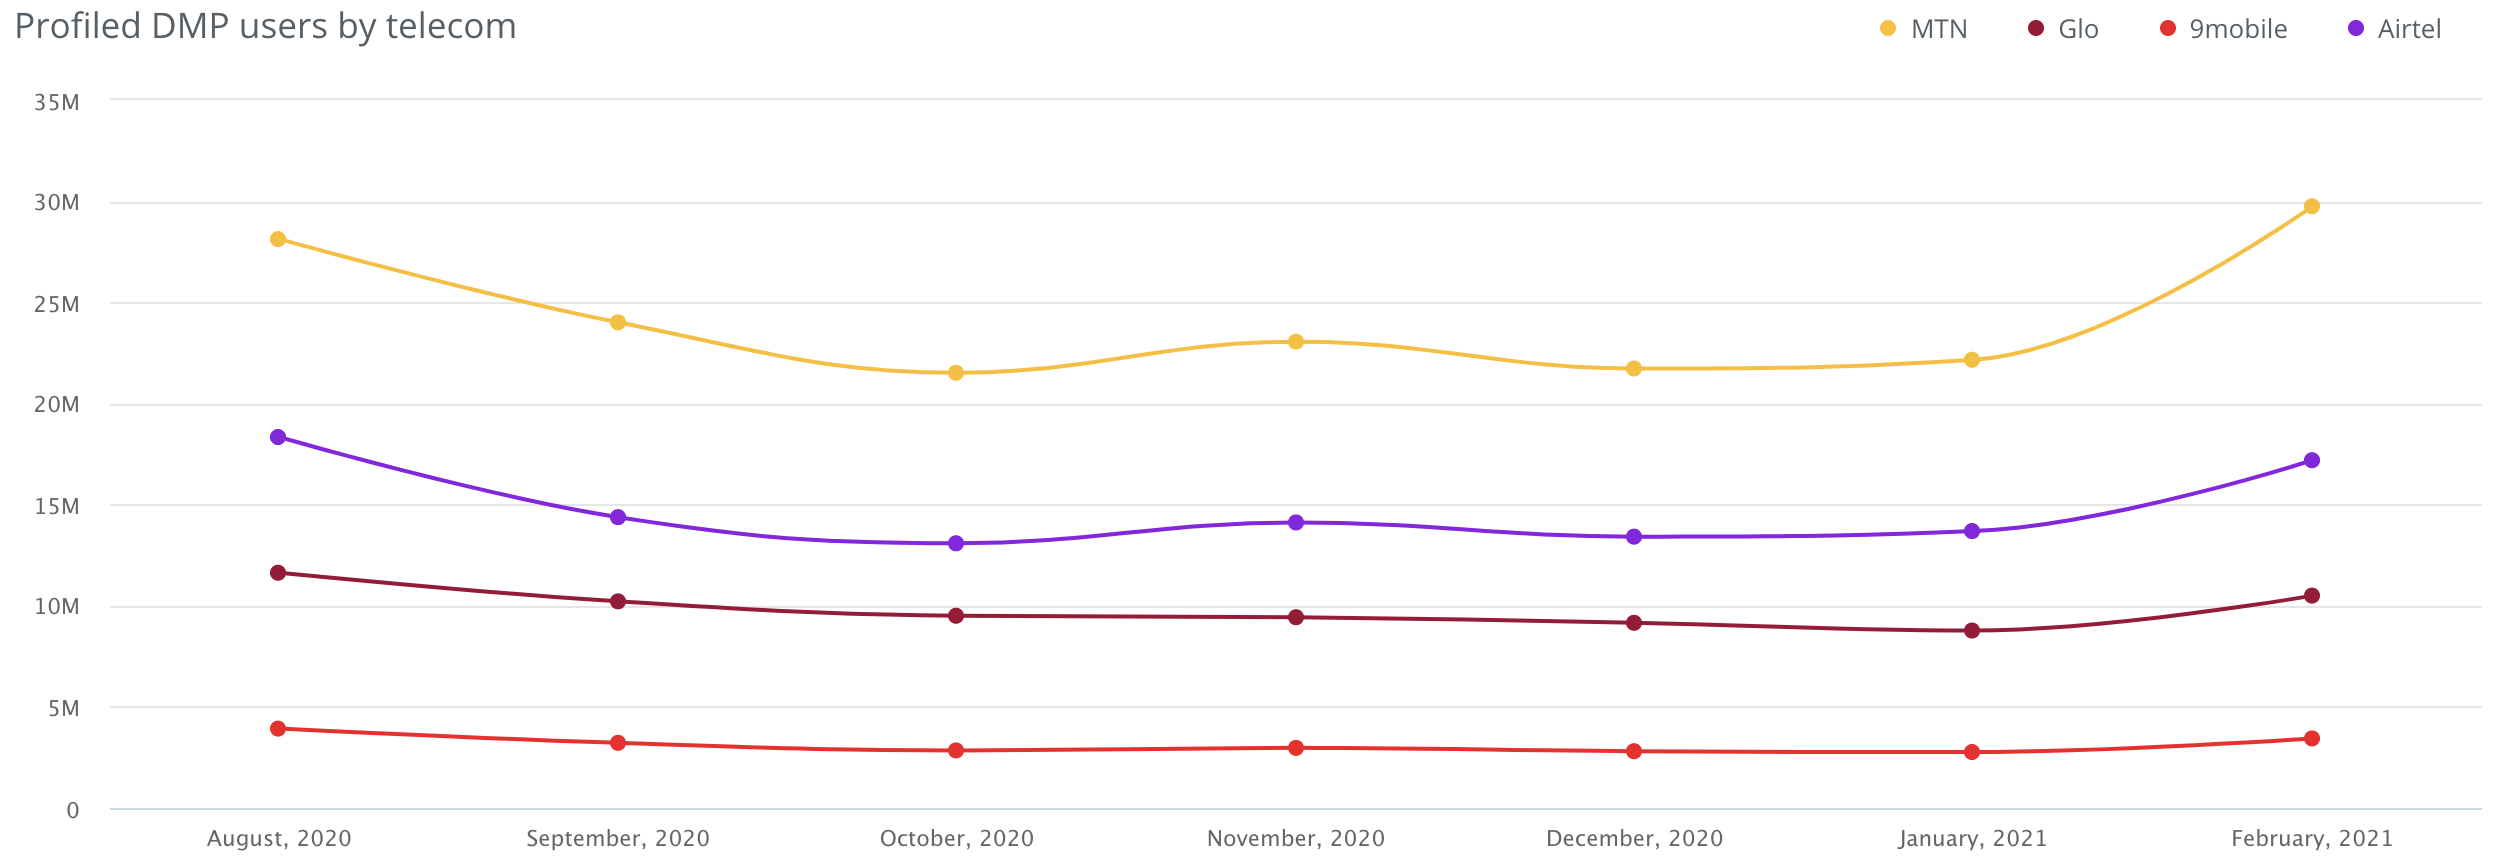
Profiled DMP users
The numbers is this widget are unique users - DMP IDs. |
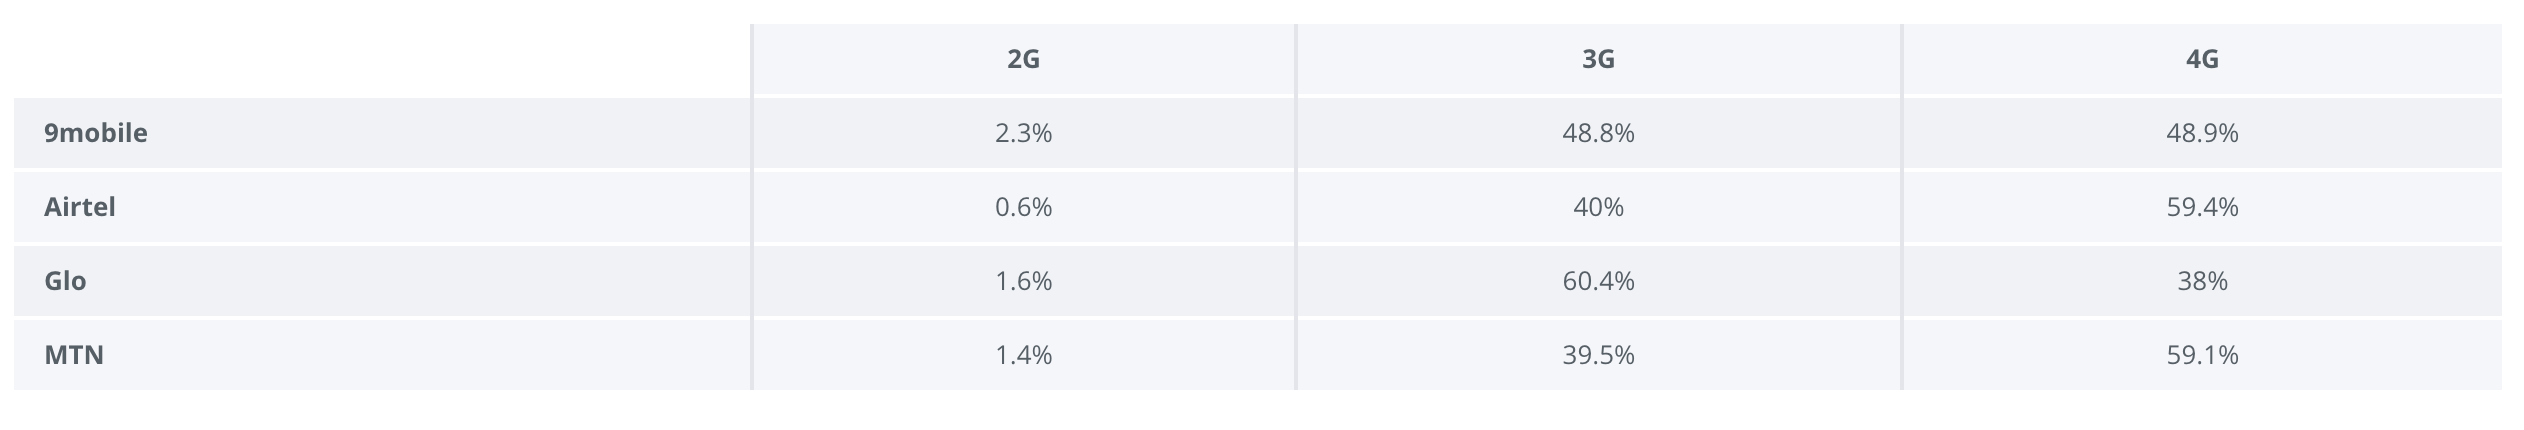
Users by network type
This widget shows how many Mobile Network Operator (MNO) clients are using which network type.The data source: impressions.
|


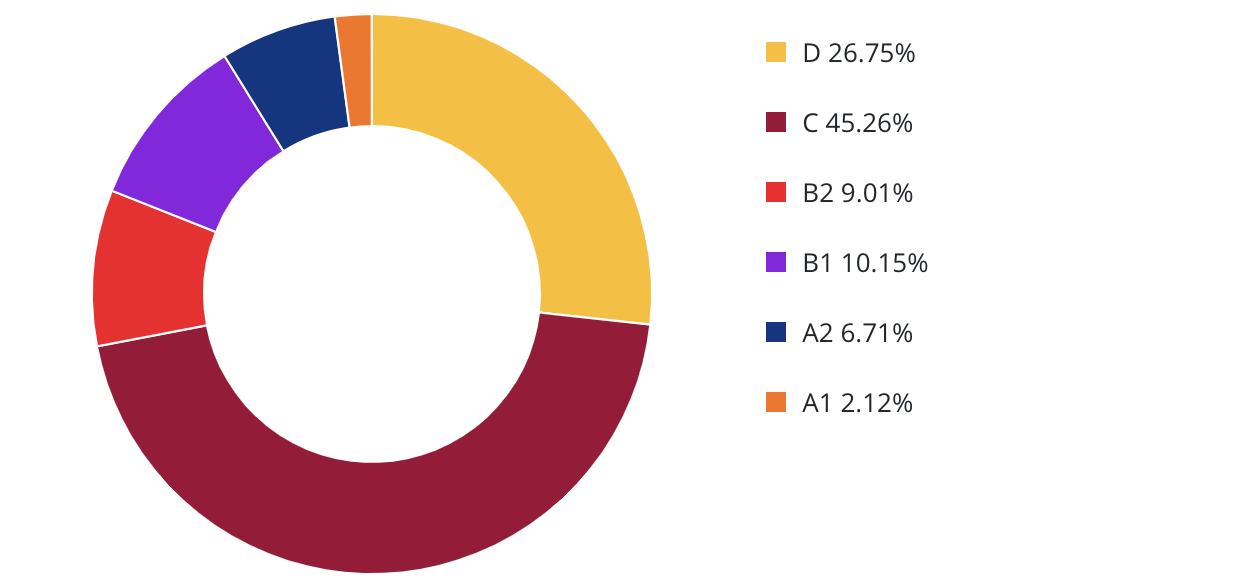
SEC
SEC (Social Economic Class) widget is dedicated to show the clients' split by SEC per each Mobile Network Operator (MNO). |
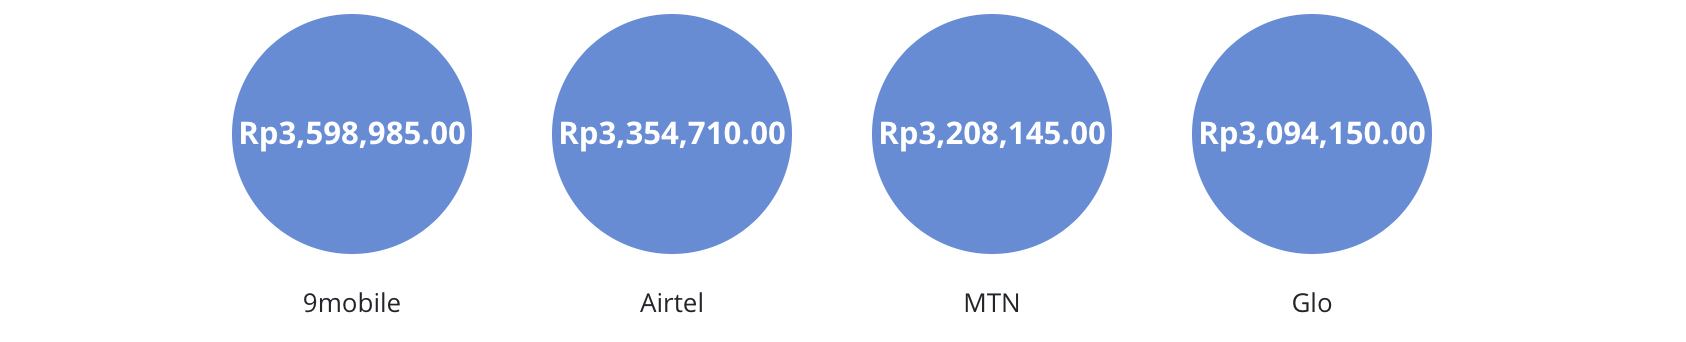
Device average retail price
This widget shows the average device retail price per Mobile Network Operator (MNO). |
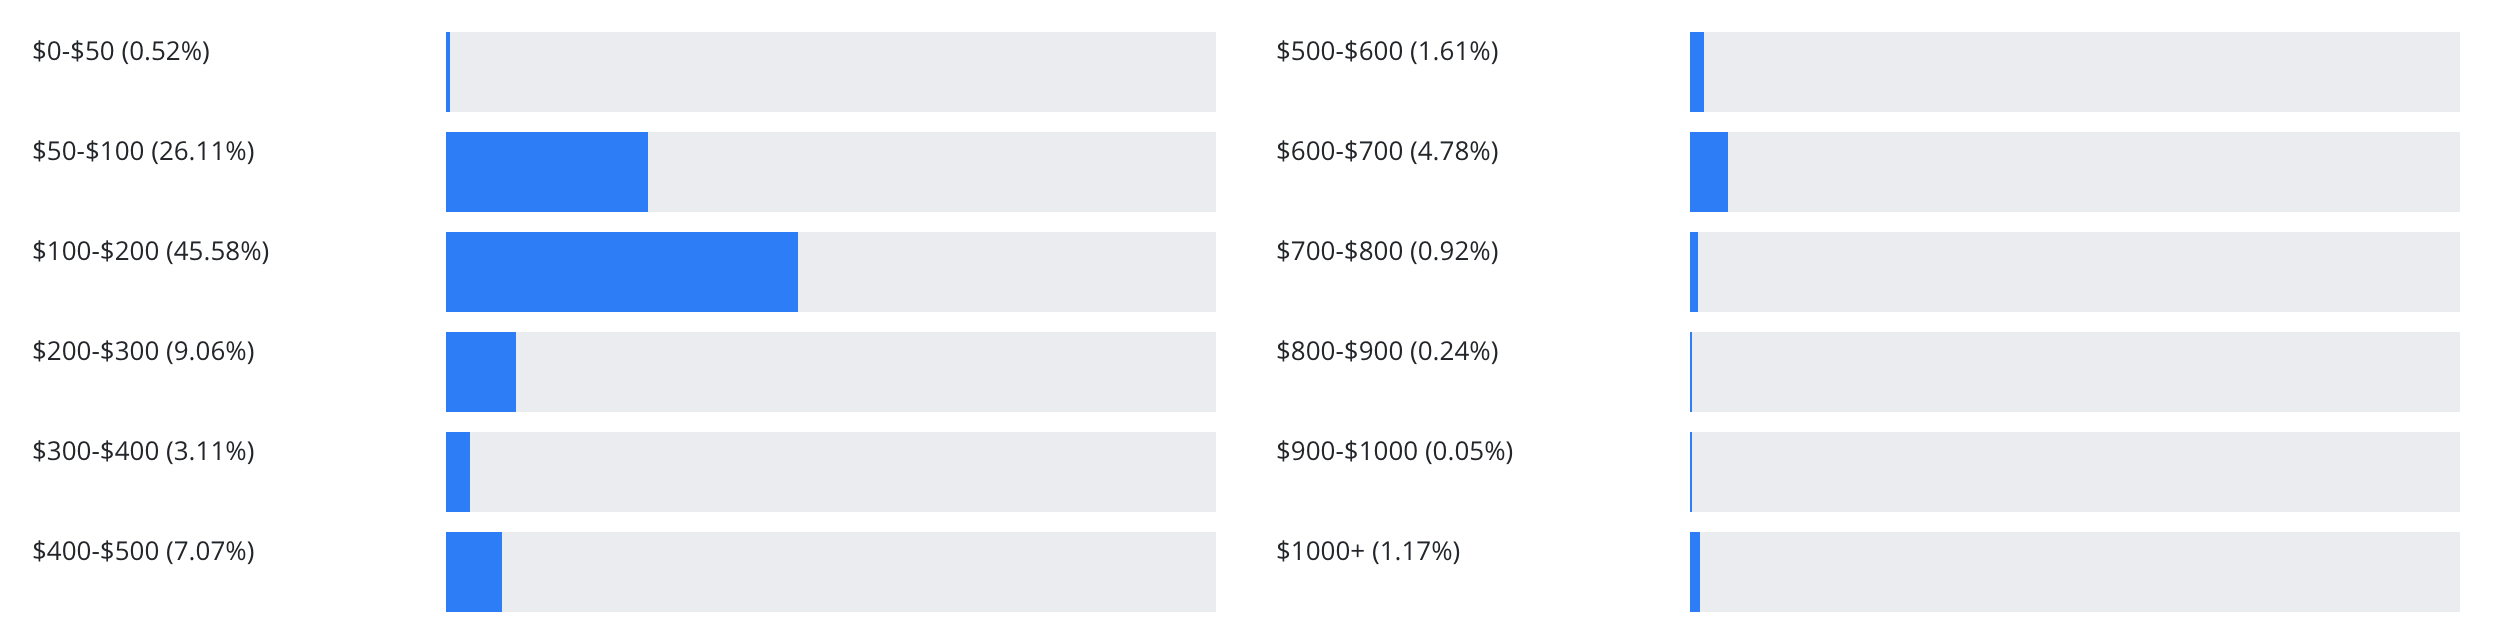
Users by device price
This widget shows the number of users (in percents) owning the device from the certain price range. |

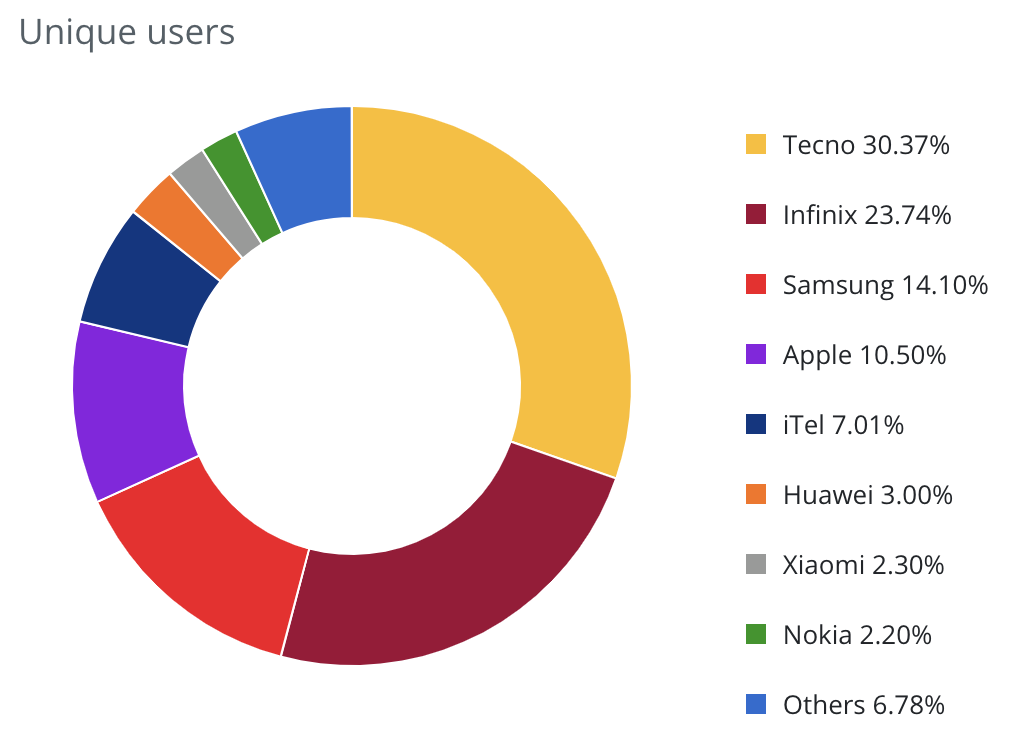
Brand market share
This widget shows the market split by the most popular mobile device brands. The data source: unique users (DMP IDs). |
TOP device brands
This widget shows the most popular mobile device brands per Mobile Network Operator (MNO). The data source: unique users (DMP IDs).
|
TOP devices
This widget shows the most popular mobile device models in the market for the past month.
|
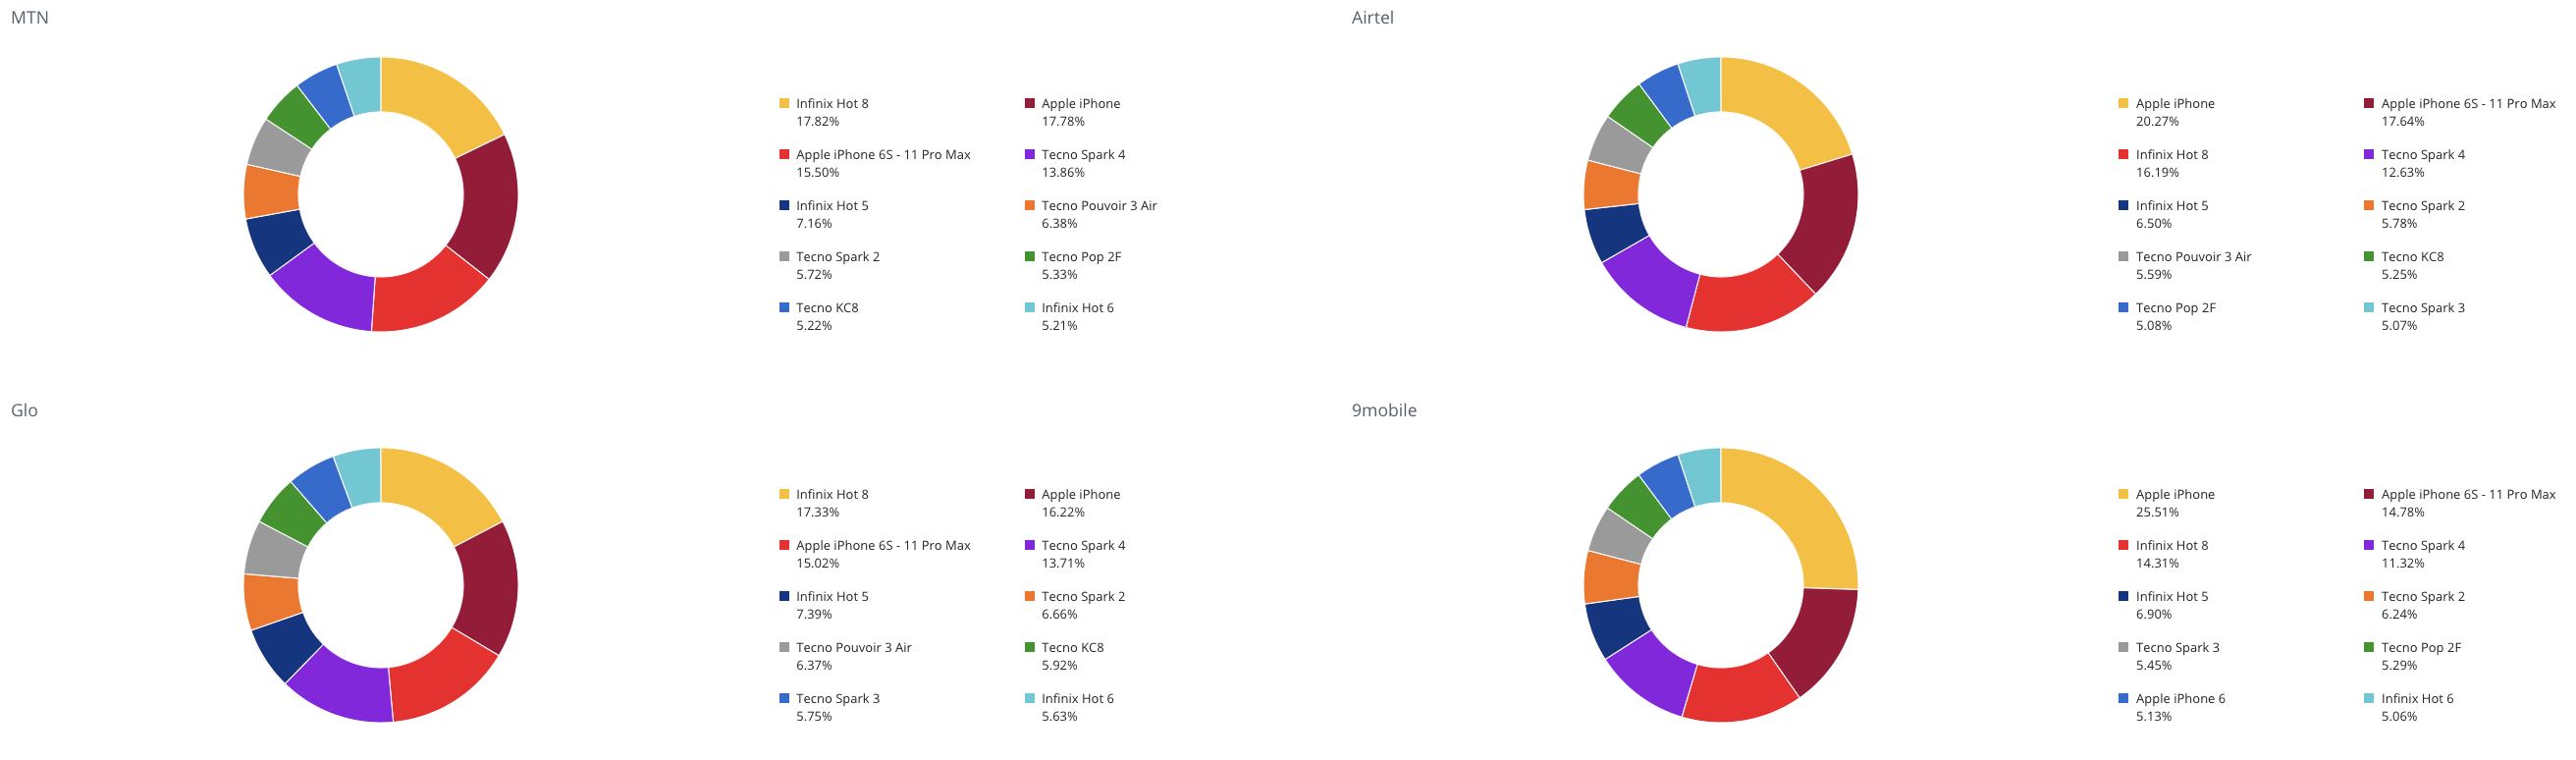
TOP device share
This widget shows the most popular mobile device models per Mobile Network Operator (MNO).
|
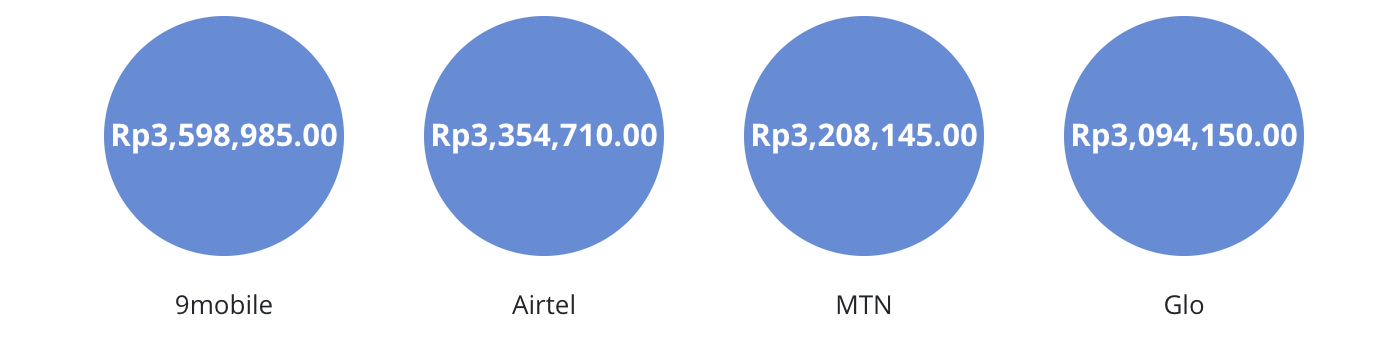
Device average retail price
This widget shows the average device retail price per Mobile Network Operator (MNO).
|
Fastest growing models
This widget shows fastest growing device models (in percent). The growth percent might be much higher than 100% due to new device growth "from zero to hero". |
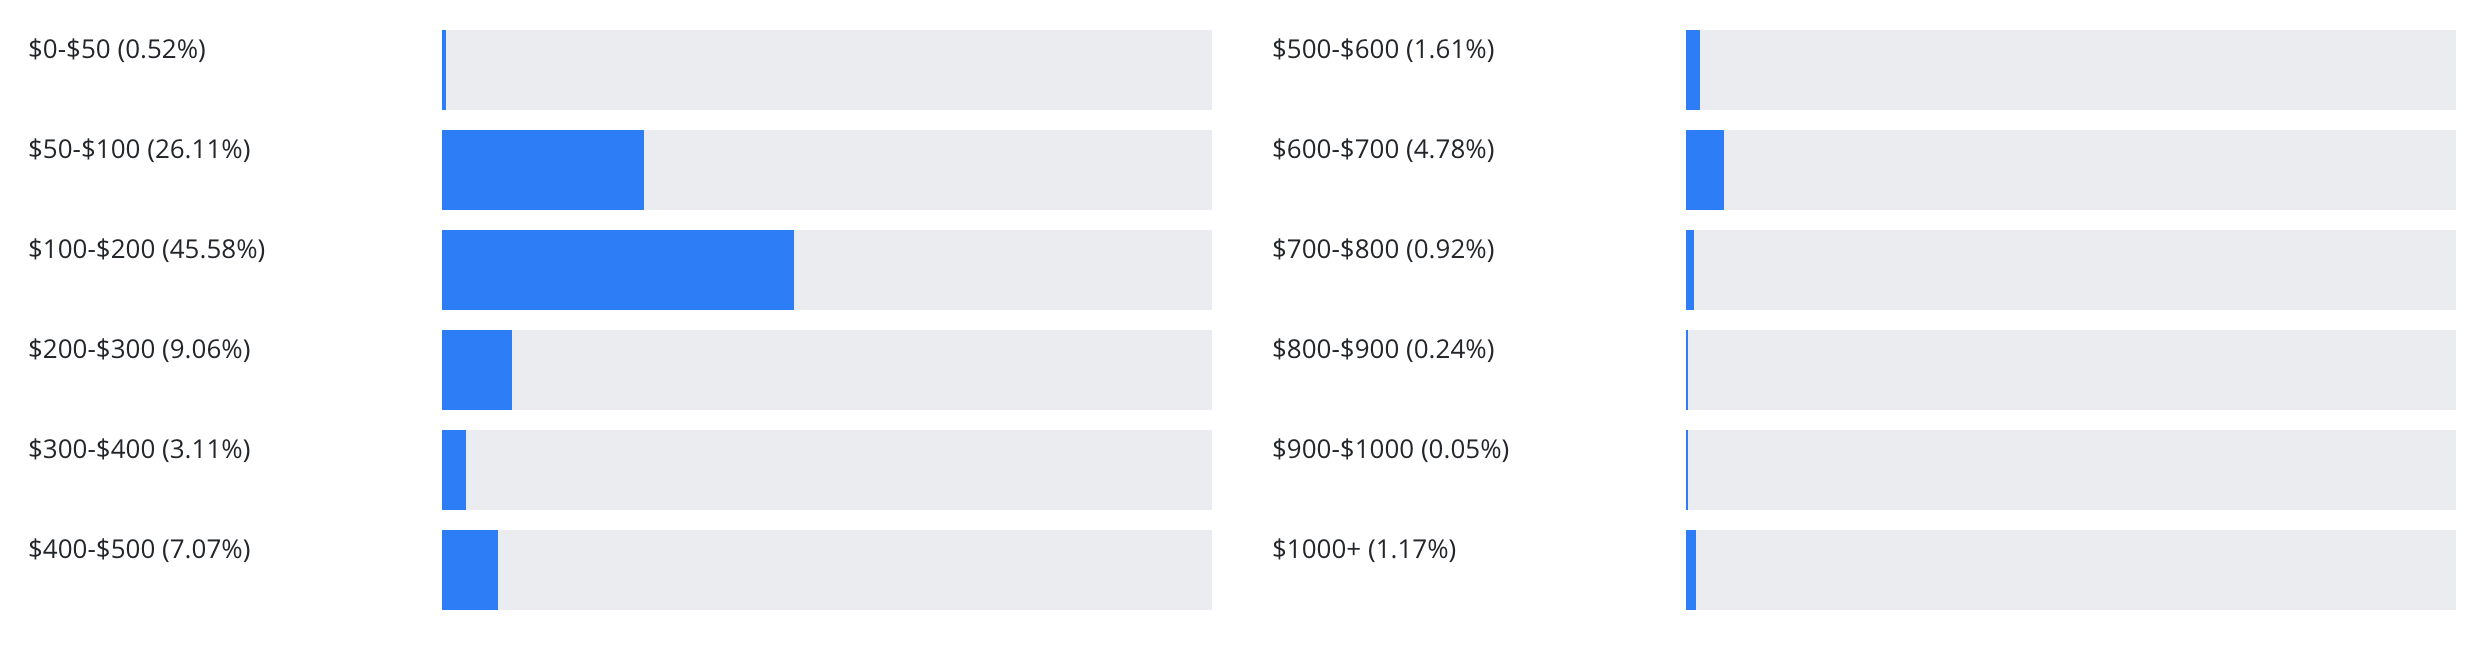
Users by device price
This widget shows the number of users (in percents) owning the device from the certain price range.
|
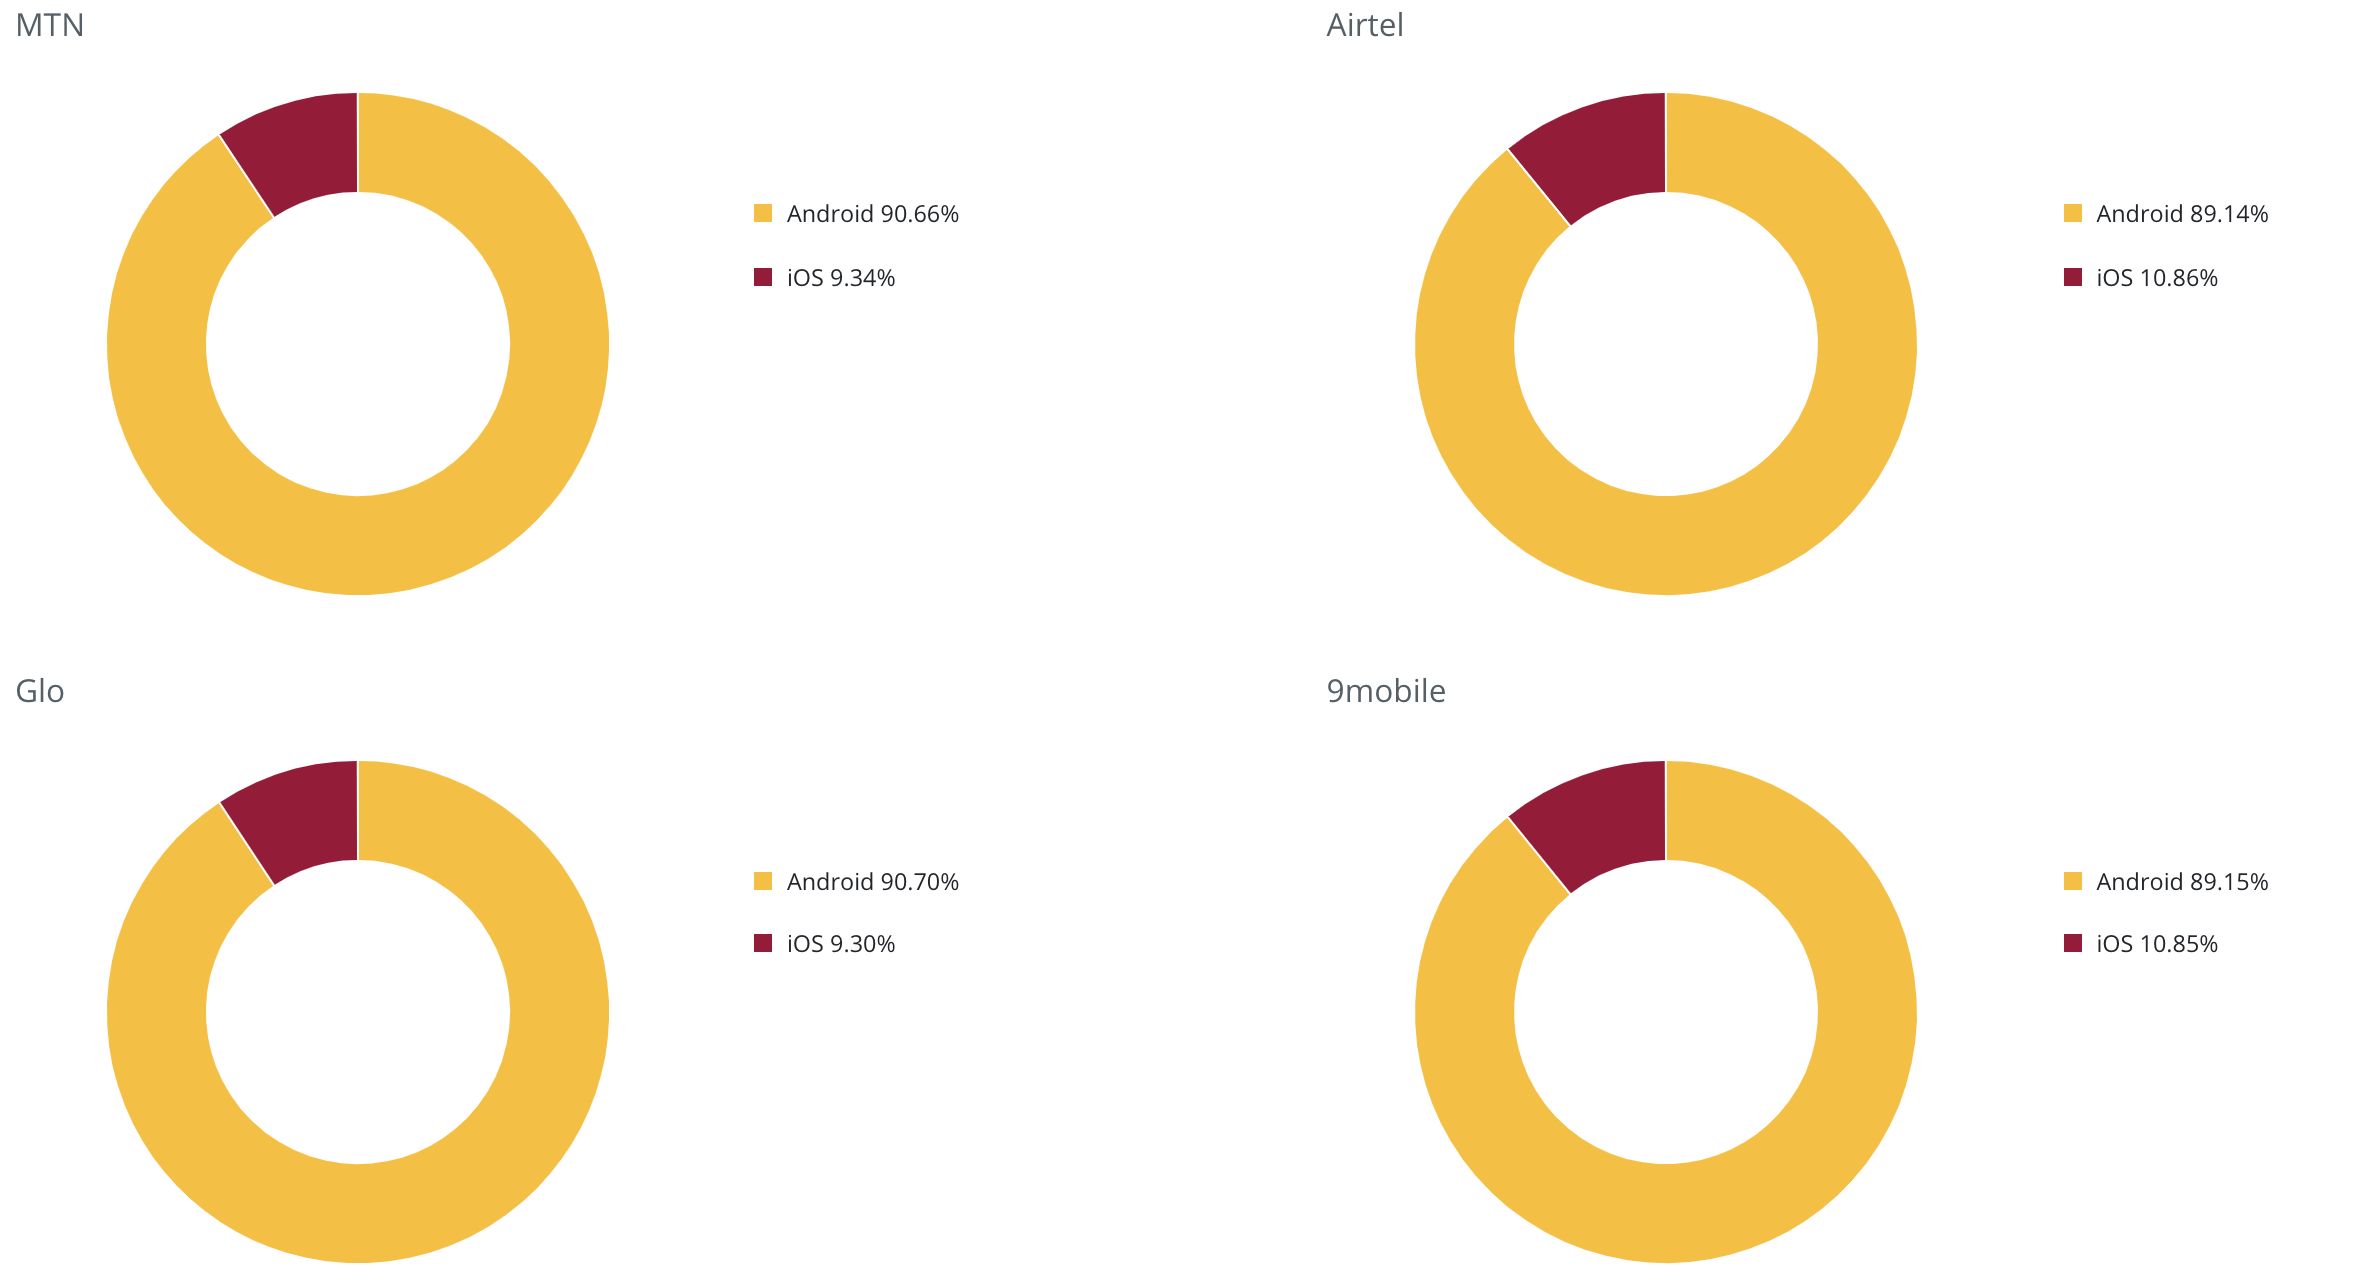
Device base comparison
This widget shows device split by the operating system (OS) per Mobile Network Operator (MNO). The other OSs are not shown if its usage is relatively low. |