Report overview and how to download it?
To analyze the performance of your campaign look into the report section to get some insights. To get more insights and analyze the performance of your campaign you can download reports directly from your Eskimi DSP account in several formats: .xls, .pdf, or .pdf (with charts).
Follow these simple steps to export the data.
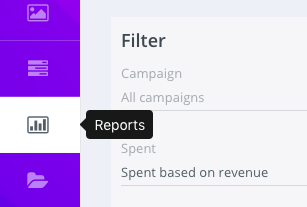
1. When you log in to your account, select the "Reports" menu on the left of your screen.
2. Customise your report based on the available filters.
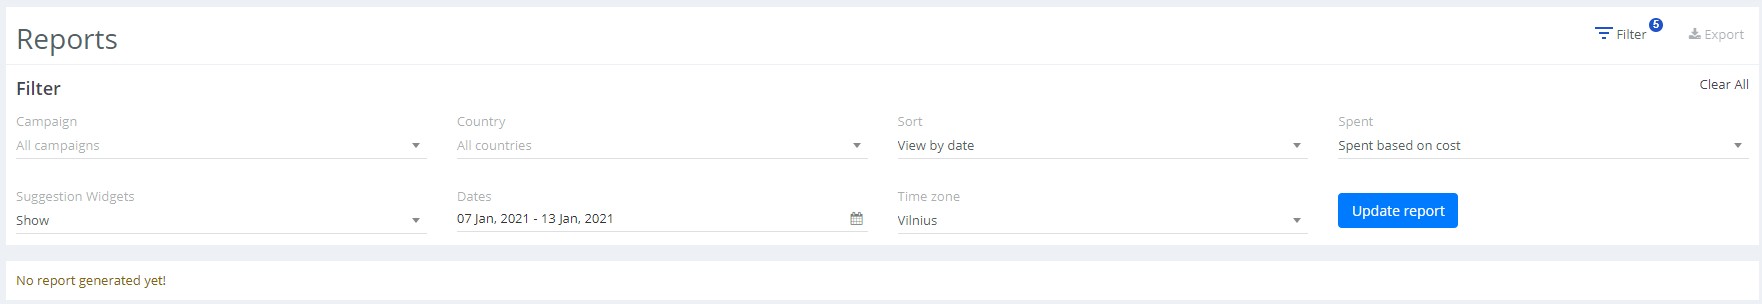
You can generate one report for all your campaigns or just select a particular one campaign. If you are running campaigns in several different countries, you can generate a report just for one of them by selecting the name of the country. You can choose the view of the report by date, by campaign or by country. Each of the filters is displayed in a convenient pop-up. And don't forget to choose the time period.
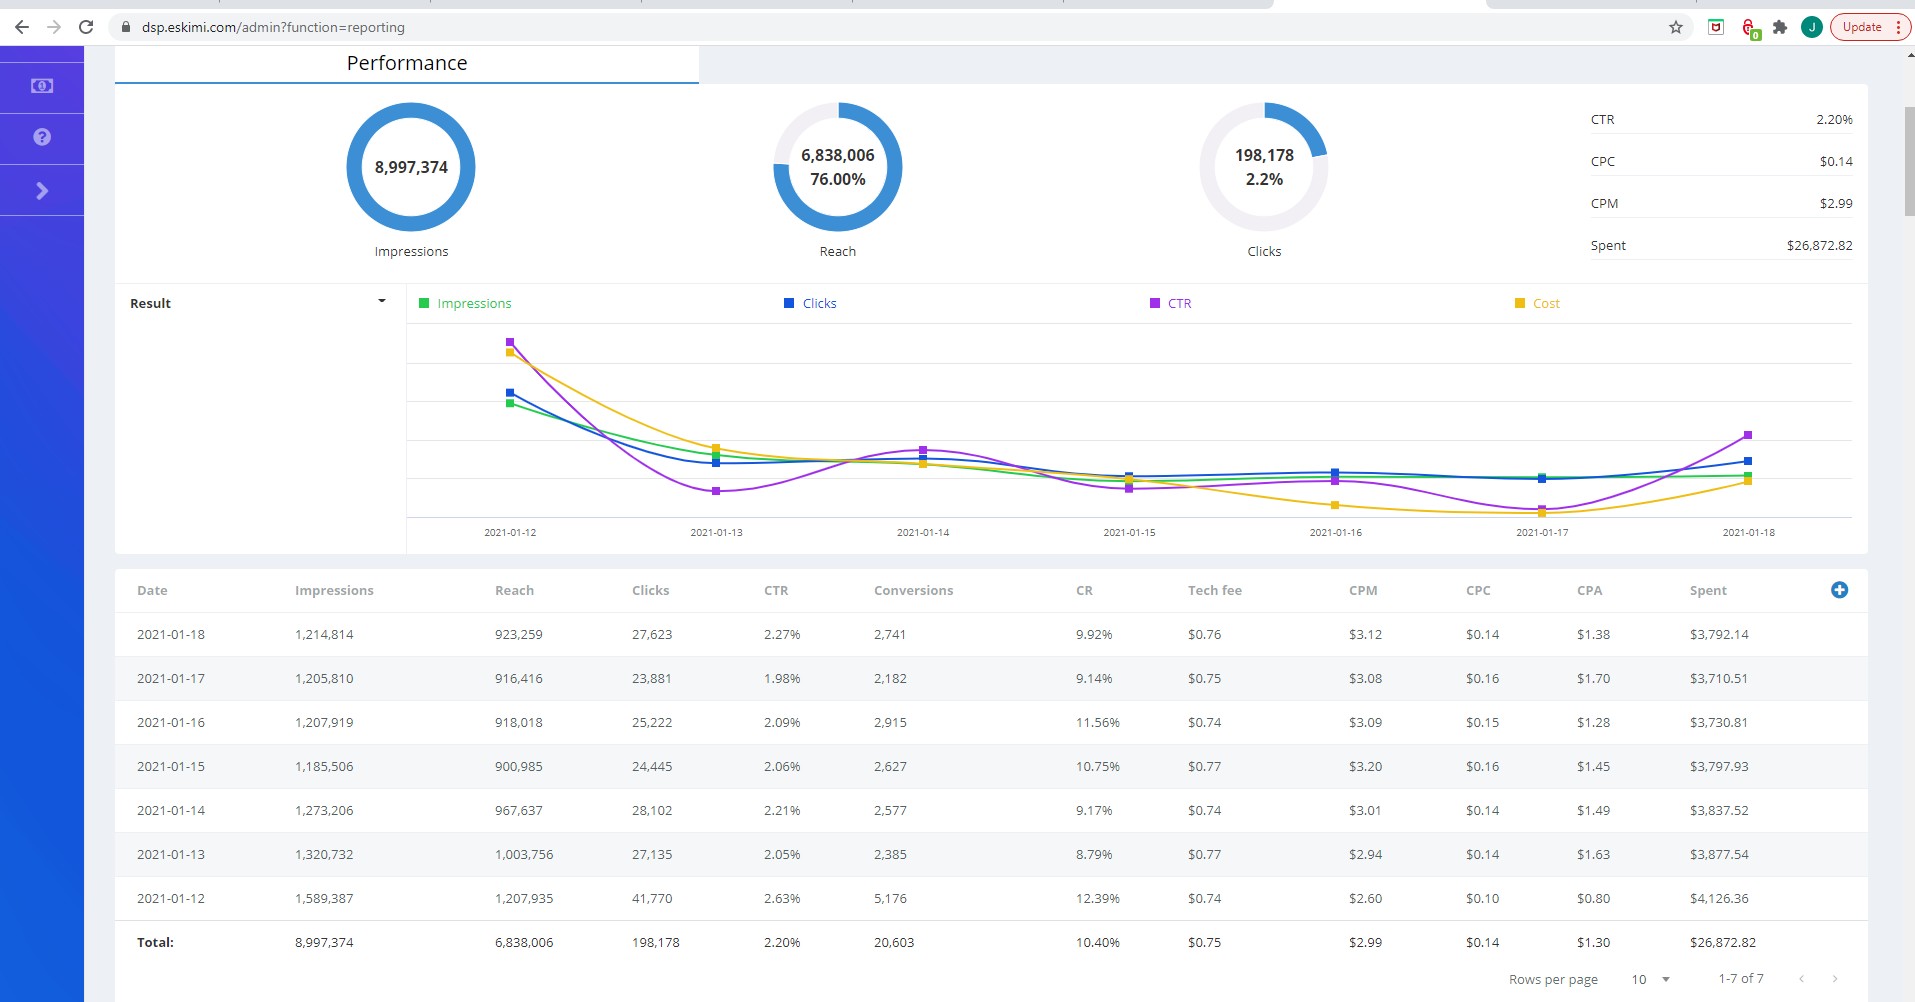
3. Now Scroll down and you'll be able to see the generated report together with data visualization according to your selections. You can follow daily performance as well.
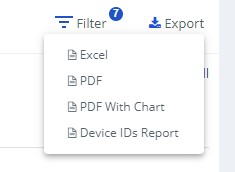
4. Download the entire report in 3 different formats: .xls, .pdf or .pdf with charts. On the top right of your screen find the there buttons. Each button corresponds to the format of the report.